Performance plots, Figure 1. fft (48 khz, 0 db), Figure 2. fft (48 khz, -60 db) – Cirrus Logic CDB4365 User Manual
Page 7: Figure 3. fft (48 khz, no input), Figure 4. fft (48 khz out-of-band, no input)
DS670DB3
7
CDB4365
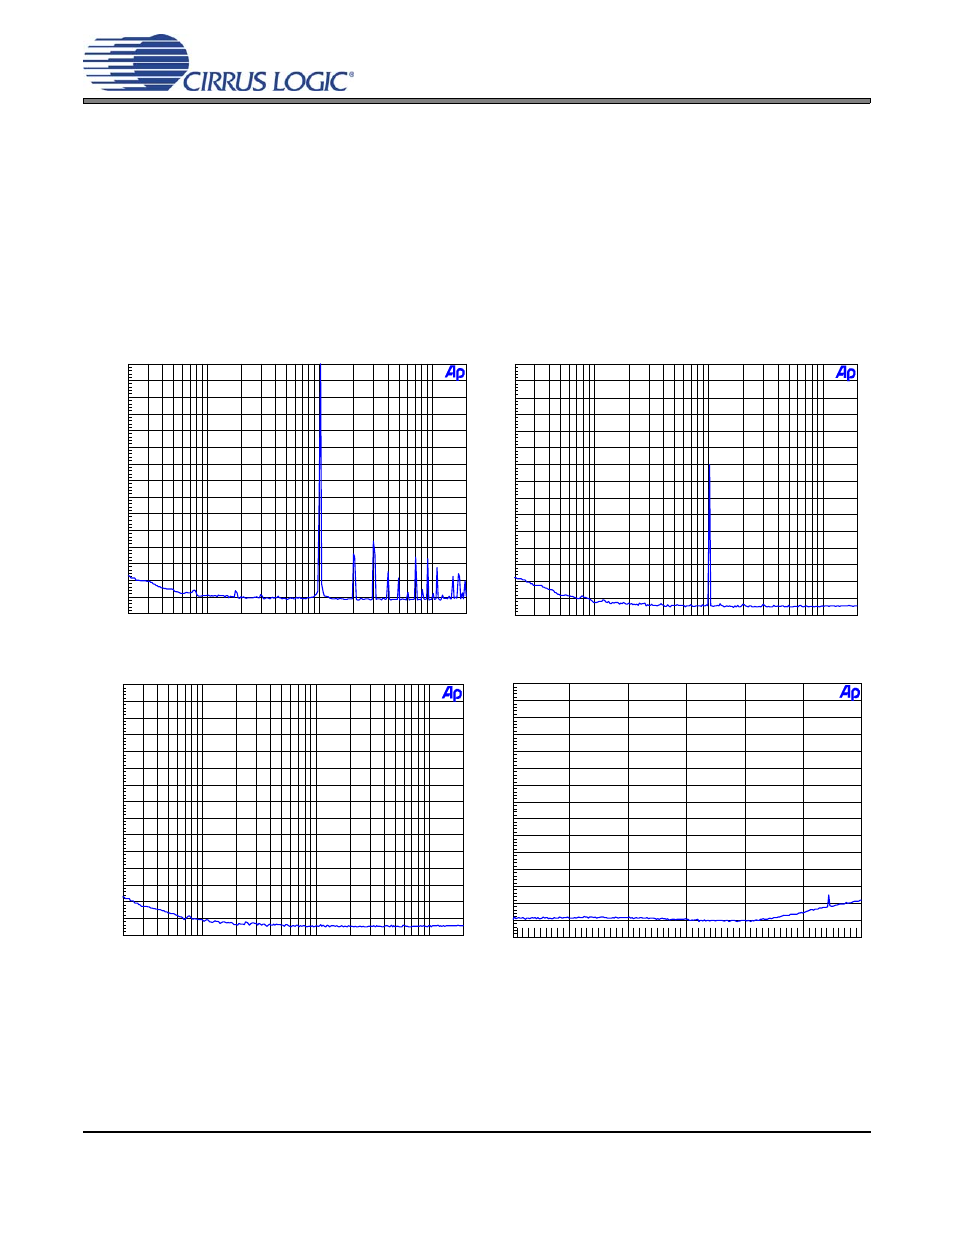
8. PERFORMANCE PLOTS
The plots in the following section were acheived using an Audio Precision System 2700 and a randomly chosen pro-
duction CDB4365. In some cases the performance may be limited by the CDB4365. All measurements were taken
at room temp using the standard AP filter options (20 Hz to 22 kHz) with default board settings and nominal
datasheet voltages applied unless otherwise noted.
The impulse response plots were taken both pre-and post filtering as the off-chip filter was degrading the perfor-
mance at higher sample rates. The pre-filter impulse response plots were taken directly at the output pins of the
DAC (with the analog filter still connected) to show the effect of the CDB’s analog filtering on the impulse response
(as the analog filtering adds its own signature to the impulse response of the DAC, and in the case of the higher
sampling rates it was band-limiting it).
-150
+0
-140
-130
-120
-110
-100
-90
-80
-70
-60
-50
-40
-30
-20
-10
d
B
r
A
20
20k
50
100
200
500
1k
2k
5k
10k
Hz
-150
+0
-140
-130
-120
-110
-100
-90
-80
-70
-60
-50
-40
-30
-20
-10
d
B
r
A
20
20k
50
100
200
500
1k
2k
5k
10k
Hz
Figure 1. FFT (48 kHz, 0 dB)
Figure 2. FFT (48 kHz, -60 dB)
-150
+0
-140
-130
-120
-110
-100
-90
-80
-70
-60
-50
-40
-30
-20
-10
d
B
r
A
20
20k
50
100
200
500
1k
2k
5k
10k
Hz
-150
+0
-140
-130
-120
-110
-100
-90
-80
-70
-60
-50
-40
-30
-20
-10
d
B
r
A
20k
120k
40k
60k
80k
100k
Hz
Figure 3. FFT (48 kHz, No Input)
Figure 4. FFT (48 kHz Out-of-Band, No Input)