Campbell Scientific TGA100A Overview User Manual
Page 7
TGA100A Trace Gas Analyzer Overview
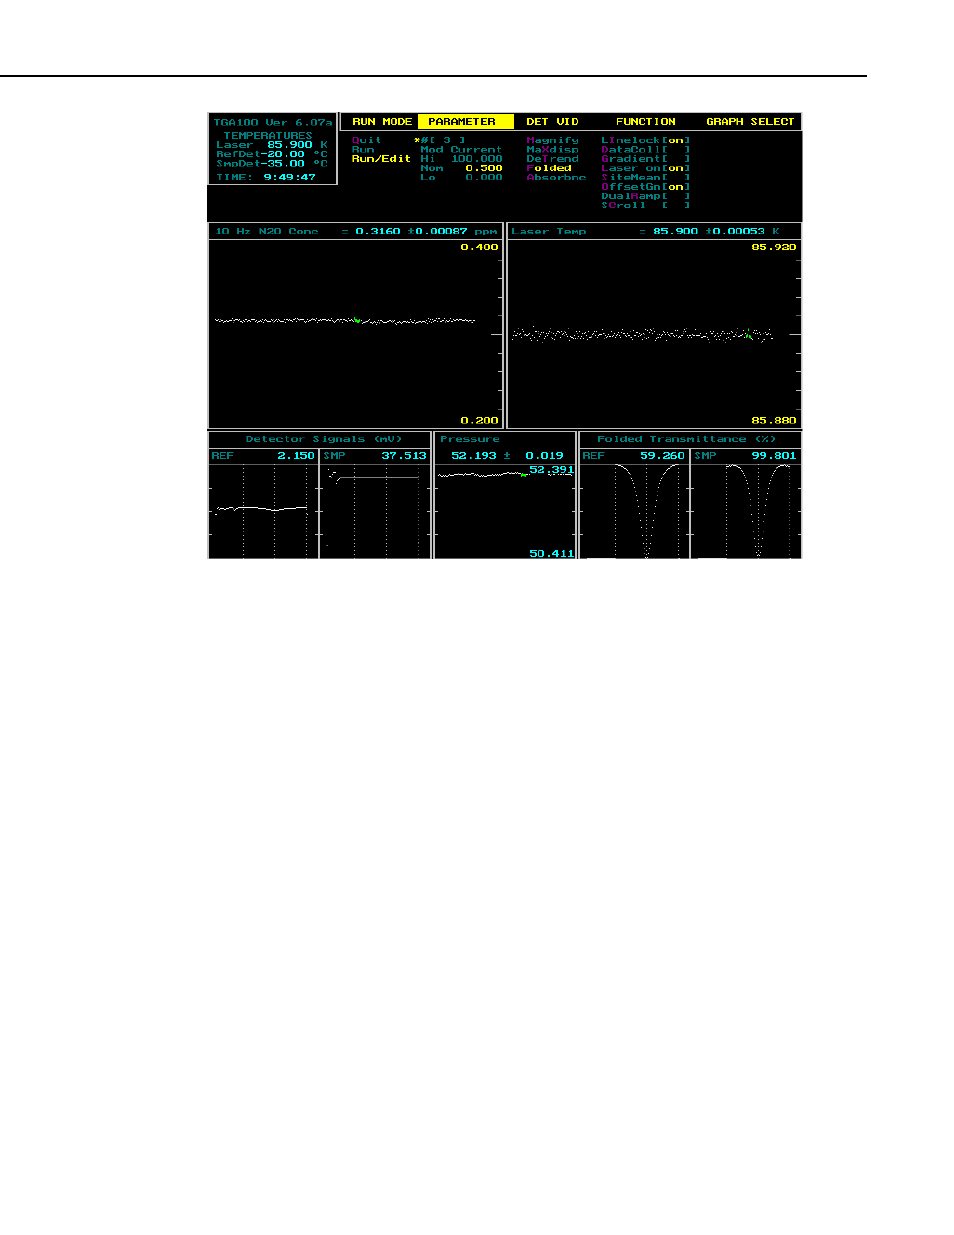
FIGURE OV5-1. Real Time Graphics Screen
In the middle of the screen are graph 1 and graph 2, used to display user-
selectable variables. This example shows N
2
O concentration in graph 1 and
laser temperature in graph 2. Graph 3 is located at the bottom-center of the
screen, and is also used to display user-selected variables. In this example
graph 3 shows the sample cell pressure.
At the bottom left corner of the screen are two high speed graphic windows
that show the raw reference (REF) detector signal and the raw sample (SMP)
detector signal, scaled to match the analog-to-digital converter (ADC) input
range. At the bottom right corner of the screen are two more high speed
graphic windows that display processed reference and sample signals. The user
may select the type of data to display in these windows using the Detector
Video menu or the Quick Keys. The number displayed at the top of these
windows is either the transmittance or the absorbance at the center of the
spectral scan, depending on the display mode selected. All four of the high-
speed graphic windows have three vertical dashed lines. These lines show the
center of the spectral scan and the range of data actually used to calculate
concentration.
Many of the operating parameters can be edited at the real time screen using
the Parameters menu column. Other parameters are available at the Parameter
Change menu.
OV-7