Ov7. specifications, Ov7.1 measurement specifications – Campbell Scientific TGA100A Overview User Manual
Page 12
TGA100A Trace Gas Analyzer Overview
OV7. Specifications
OV7.1 Measurement Specifications
The preliminary frequency response and noise specifications given in this
section are based on performance of the TGA100, which has a 10 Hz update
rate. The TGA100A has a faster update rate, which should give improved
performance.
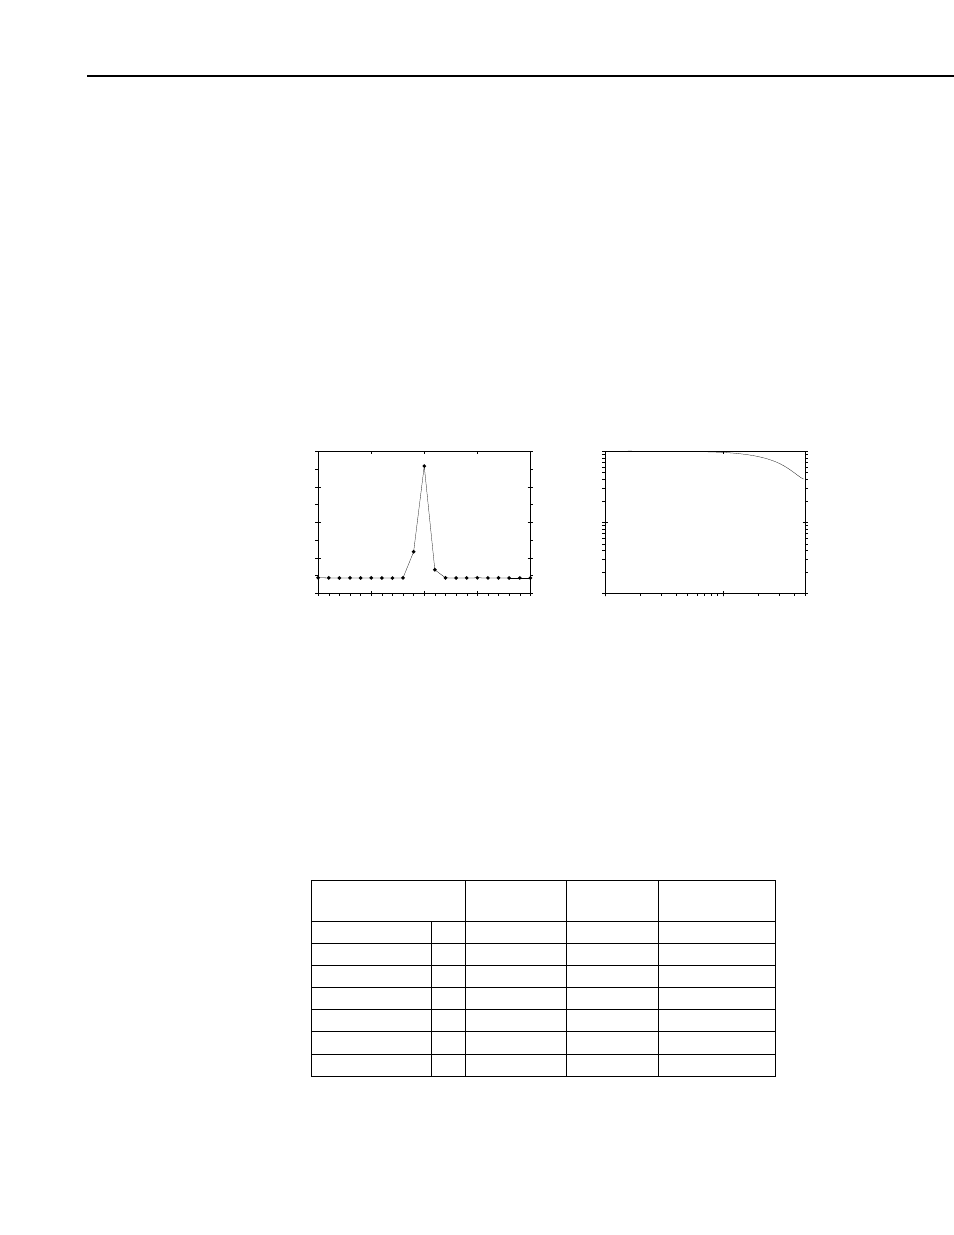
The frequency response is determined by the time required to flush the sample
cell (480 ml volume). The frequency response was measured at 14.4 slpm flow
rate and 50 mbar sample pressure (4.8 actual l/s) by injecting approximately 1
μl of N
2
O into the sample stream. The resulting time series and frequency
response graphs are shown below (TGA100 data are shown, with a 10 Hz
update rate).
0.0
0.5
1.0
1.5
2.0
0
1
2
3
4
Concentration (ppmv)
Time (sec)
0.1
1
5
0.01
0.1
1
Frequency Response
Frequency (Hz)
FIGURE OV7.1-1. Time Series (left) and Frequency Response (right)
The typical 10 Hz concentration measurement noise is given as the square root
of the Allan variance with no averaging (i.e. the two-sample standard
deviation. This is comparable to the standard deviation of the 10 Hz samples
calculated over a relatively short time (10 s). The typical 30-minute average
gradient resolution is given as the standard deviation of the difference between
two intakes, averaged over 30 minutes. Values shown in Table OV7.7-1 are for
ambient concentrations.
TABLE OV7.1-1. Typical Concentration Measurement Noise
Gas Wave
number
(cm
-1
)
10 Hz Noise
(ppbv)
30-min Gradient
Resolution (pptv)
Nitrous Oxide N
2
O
2208.575 1.5
30
Methane CH
4
3017.711 7
140
Ammonia NH
3
1065.56 6
200
Carbon Monoxide CO
2176.284
3
60
Nitric Oxide
NO
1900.08
13
260
Nitrogen Dioxide NO
2
1630.33 3
60
Sulfur Dioxide SO
2
1366.60 25
500
OV-12