Statistics view, Graph view – Vaisala SHM40 User Manual
Page 41
Chapter 4 ____________________________________________________ Using the HM40 Indicator
VAISALA _______________________________________________________________________ 39
Statistics View
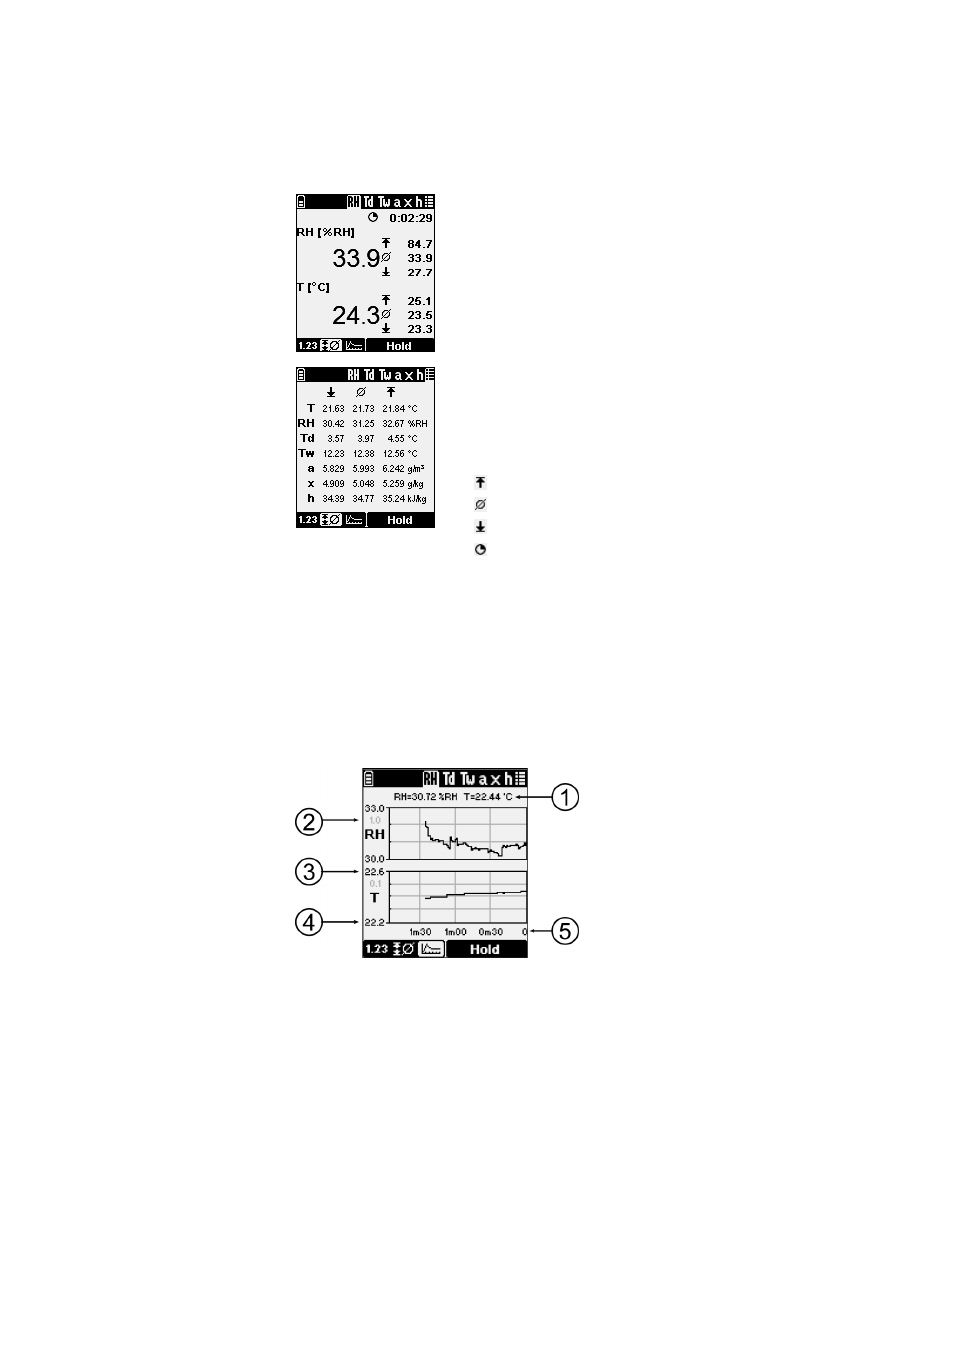
The Statistics view shows the current value of the
selected quantity, as well as the maximum,
average, and minimum value since the
measurement was started. There is also a counter
that shows how long the measurement has been
running.
The counter for measurement time is not shown
in the all quantities view.
The icons are:
Maximum
Average
Minimum
Measurement time
Graph View
The Graph view shows a continuously updating graph of the selected
quantity and temperature. The graph limits and spacing adjust
dynamically to show the full range of measurements.
1111-096
Figure 18
Elements of the Graph View
where
1 = Current
values
2 = Vertical spacing of the grid
3 = Graph
maximum
4 = Graph
minimum
5 = Time