Example 5 – HP PolyServe Software User Manual
Page 12
Advanced I/O Monitoring
9
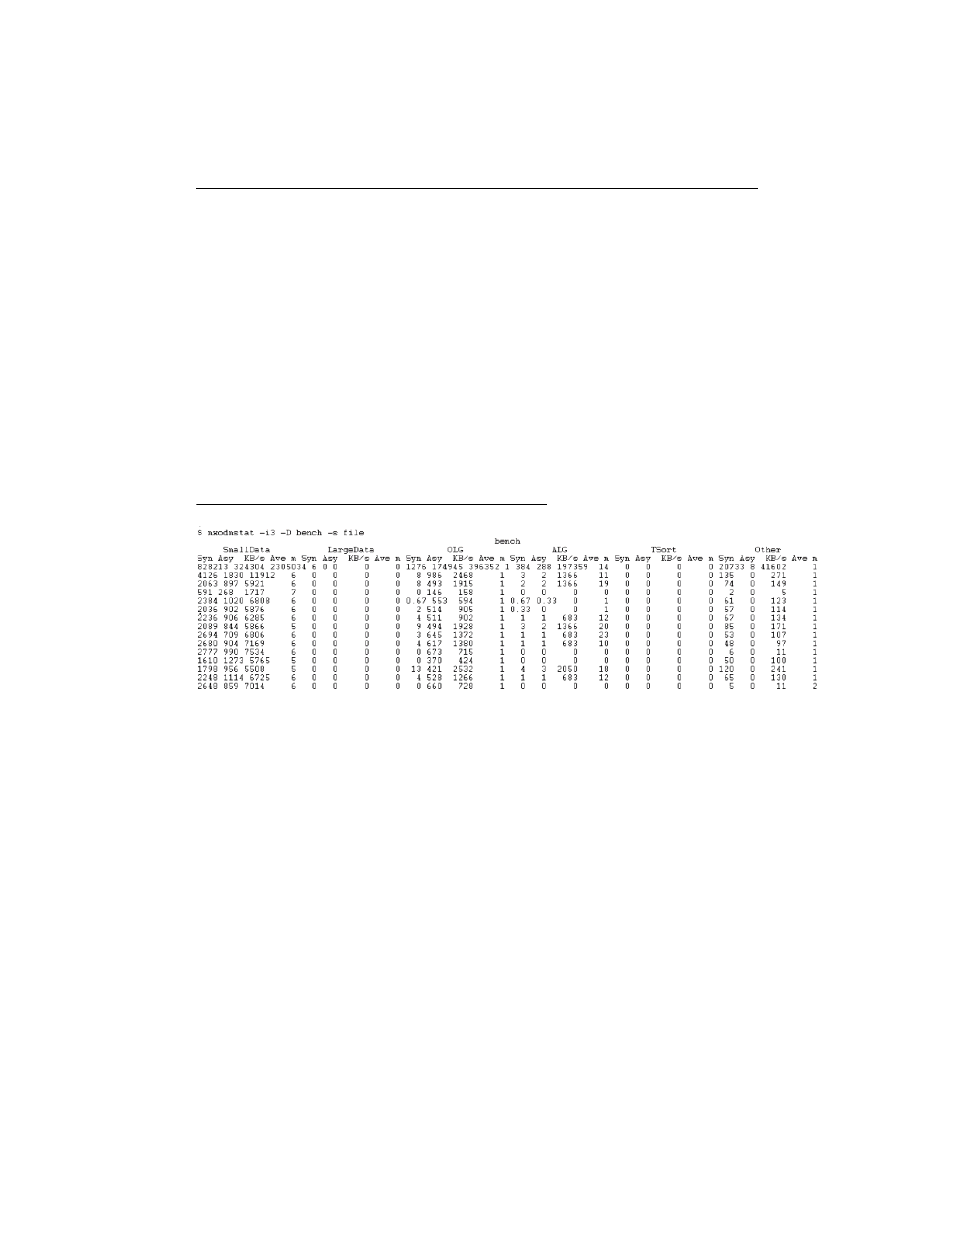
• Large Data. I/O transfers of sizes greater than 16K are reported under this
column. Generally, these will be full table scan driven (e.g., db file scattered
read or direct path read,direct path write).
• OLG. This column is for Online Redo Log I/O activity (e.g.,
LGWR
).
• ALG. This column is for Archived log activity (e.g.,
ARCH
).
• Sort. This column tracks I/O operations to/from temporary tablespaces (e.g.,
sorting).
• Other. All activity not fitting the other types is tracked under this column (e.g.,
control file writes, etc.).
Figure 4 contains an example of the -s file option/argument pair.
Figure 4
Example 5
Question: At fixed times during the week, the majority of my OLTP users are
limited to nodes 1 and 2. Nodes 5 and 6 have much more memory and are
configured for most of the large DSS and reporting activity. How can I monitor to
ensure that the very heavy I/O workload intended to run on nodes 5 and 6 is not
impacting I/O service times on the OLTP nodes?
Answer. Once again, the -I option should be used. Figure 5 depicts a perfect
example of this usage. The
BENCH5
and
BENCH6
instances are periodically
performing a burst of asynchronous I/O up to 50MB/sec, yet the
BENCH1
and
BENCH2
instances are not showing substantial increase in I/O service times.