Example 2 – HP PolyServe Software User Manual
Page 10
Advanced I/O Monitoring
7
Figure 1
Example 2
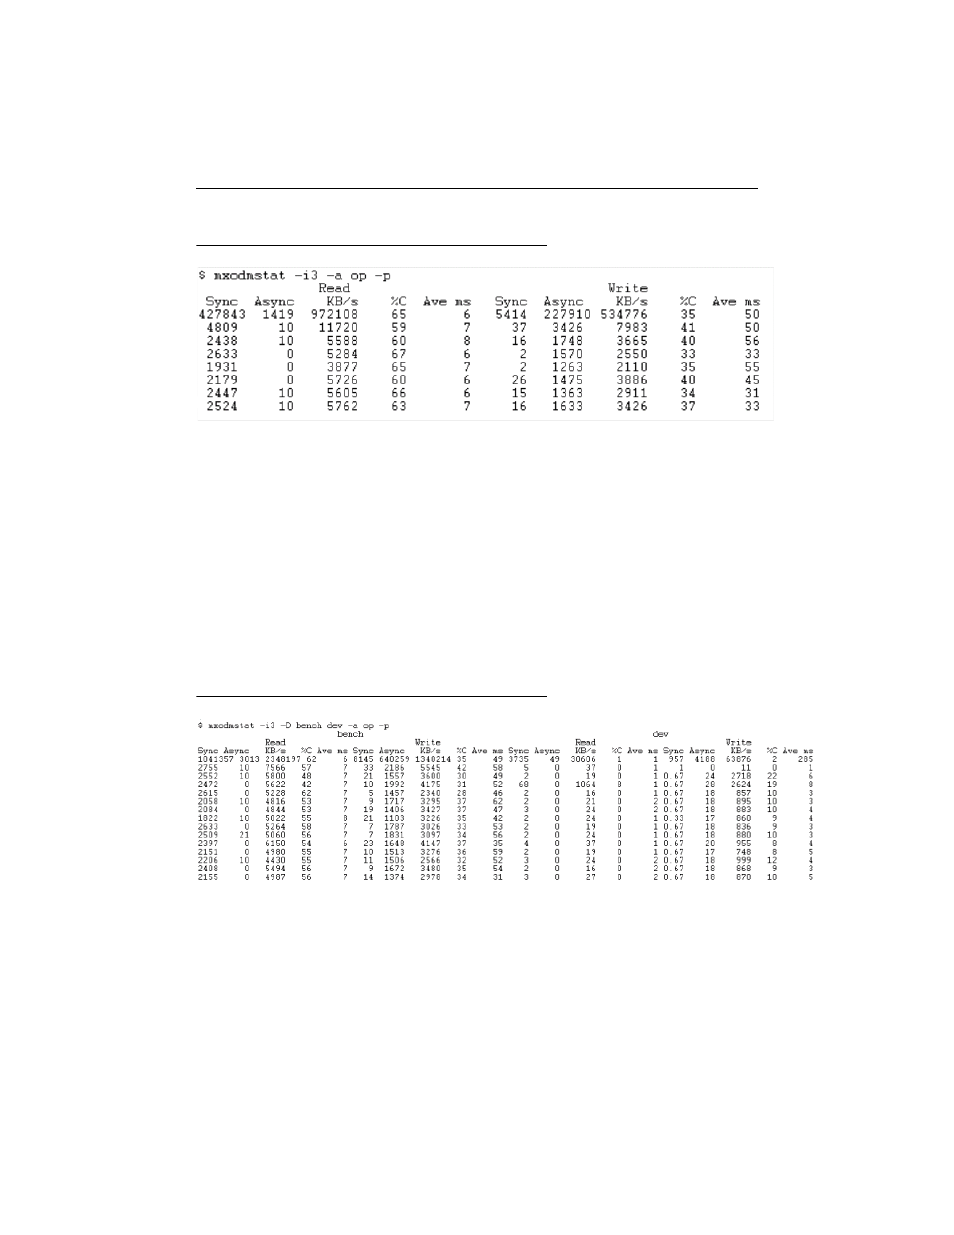
Question: How can I display the Core Reporting Elements broken out by database
with 3-second granularity?
Answer: The -D option supports monitoring a list of databases. In Figure 2, the
BENCH
and
DEV
databases are being monitored as cluster-wide entities. As such,
the data under the “bench” column represents activity from all of the instances
accessing the “bench” database—in this case, four instances. For example, the last
line of output in Figure 2 shows that during a 3-second period, all instances
accessing the “bench” database performed a total of 2155 synchronous reads and
1374 asynchronous writes.
Figure 2
See also other documents in the category HP Storage:
- StorageWorks MSL6000 Tape Library (61 pages)
- Лент-е накопители HP StoreEver DAT (64 pages)
- Лент-е накопители HP StoreEver DAT (50 pages)
- Linear Tape File System Software (25 pages)
- StoreEver Ultrium Tape Drives (78 pages)
- StoreEver Ultrium Tape Drives (76 pages)
- Linear Tape File System Software (20 pages)
- StoreEver Ultrium Tape Drives (61 pages)
- StoreEver TapeAssure Software (40 pages)
- StoreEver Ultrium Tape Drives (75 pages)
- StoreEver Ultrium Tape Drives (60 pages)
- Linear Tape File System Software (28 pages)
- 2600fx Optical Disk Drive (65 pages)
- Ленточный автозагрузчик HP StorageWorks DAT 72x10 (58 pages)
- 2000fc Modular Smart Array (150 pages)
- StorageWorks 1000 Modular Smart Array (72 pages)
- StorageWorks 1000 Modular Smart Array (81 pages)
- StorageWorks 1500cs Modular Smart Array (48 pages)
- StorageWorks 1500cs Modular Smart Array (52 pages)
- StorageWorks 1500cs Modular Smart Array (71 pages)
- Servidor de almacenamiento HP ProLiant DL585 G2 (152 pages)
- Sistemas de almacenamiento de red HP StorageWorks X3000 (152 pages)
- Software de HP StoreVirtual VSA (127 pages)
- Software de HP StoreVirtual VSA (85 pages)
- X500 Data Vault (331 pages)
- StorageWorks 1000i Virtual Library System (122 pages)
- XP Array Manager Software (101 pages)
- StorageWorks XP Remote Web Console Software (20 pages)
- 200 Storage Virtualization System (176 pages)
- StorageWorks MSA 2.8 SAN Switch (22 pages)
- StorageWorks MSA 2.8 SAN Switch (104 pages)
- StorageWorks MSA 2.8 SAN Switch (270 pages)
- StorageWorks MSA 2.8 SAN Switch (307 pages)
- StorageWorks All-in-One SB600c Storage Blade (80 pages)
- StorageWorks All-in-One SB600c Storage Blade (78 pages)
- StorageWorks All-in-One SB600c Storage Blade (60 pages)
- StorageWorks All-in-One SB600c Storage Blade (72 pages)
- ProLiant DL585 G2 Storage-Server (150 pages)
- Data Protector Express Basic-Software (83 pages)
- Data Protector Express Basic-Software (93 pages)
- ProLiant DL185 G5 Storage Server (174 pages)
- ProLiant High Availability Storage Server (72 pages)
- P2000 G3 MSA Array Systems (58 pages)
- StorageWorks 2000fc G2 Modular Smart Array (76 pages)
- 2000I G2-Modular-Smart-Array (48 pages)