Example 3, Example 4, Example 3 example 4 – HP PolyServe Software User Manual
Page 11

Advanced I/O Monitoring
8
Example 3
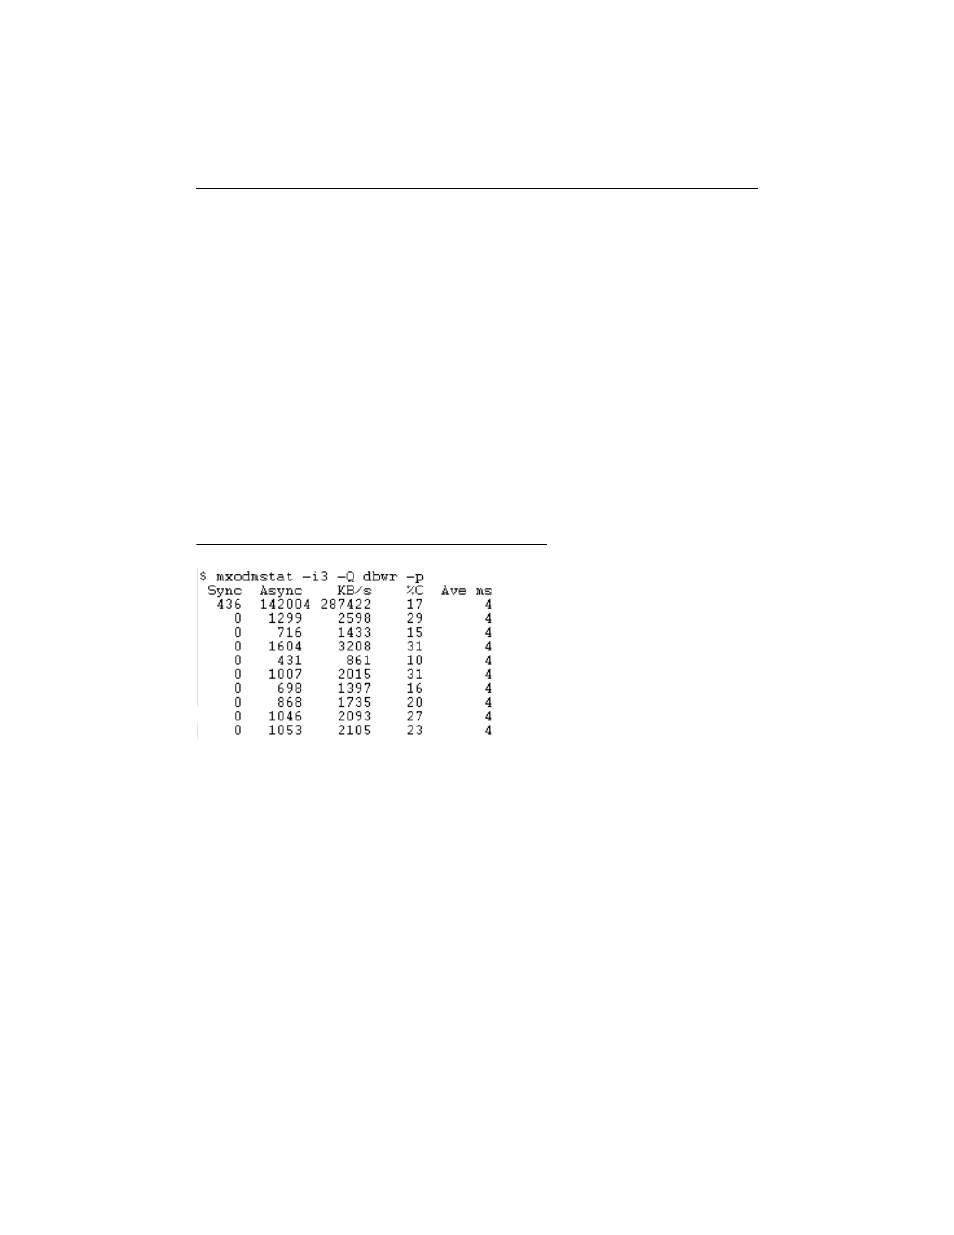
Question: I have a very complex Oracle9i RAC environment. How can I get a
“birds-eye” view of cluster-wide Database Writer activity such as I/O response
times and what percentage is that of cluster-wide I/O?
Answer: Monitoring particular database “subsystems” such as Database Writer,
Log Writer, or PQO processes as entities is possible with the -Q option. In
Figure 3, -Q is specified without an accompanying -D option. Therefore, all
cluster-wide Database Writer activity is reported.
In this example case, the output represents the aggregate dbwr activity from four
BENCH
instances and two
DEV
instances. This output is particularly helpful as it
allows a quick view into what percentage of all Oracle I/O is accounted for in
dbwr flushing activity, as well as what percentage of cluster-wide I/O that might
be. Troublesome I/O completion times for DBWR are also easily monitored.
Figure 3
Example 4
Question: It would be very convenient to have a breakout of cluster-wide single
and multi-block reads, Online Redo Log transfers, and Archive Log activity, but
only for the
BENCH
database. How can I do this?
Answer: This information can be obtained with the file argument to the -s option.
The columns reported with this set of mxodmstat(8) options are:
• SmallData. These are Oracle single-block transfers to/from datafiles. On Linux,
Oracle9i block sizes are limited to 16K. I/O reported under this column are
generally OLTP transfers (e.g., db file sequential read).
