Thermo Fisher Scientific Ion Selective Electrodes Silver User Manual
Page 11
Instruction Manual
Silver/Silver Sulfide Electrode
11
4.
Place the most concentrated sulfide standard on the magnetic stirrer and begin stirring.
After rinsing the electrodes with distilled water, blot dry and immerse the electrode tips in
the solution. When the reading has stabilized, record the mV reading.
5.
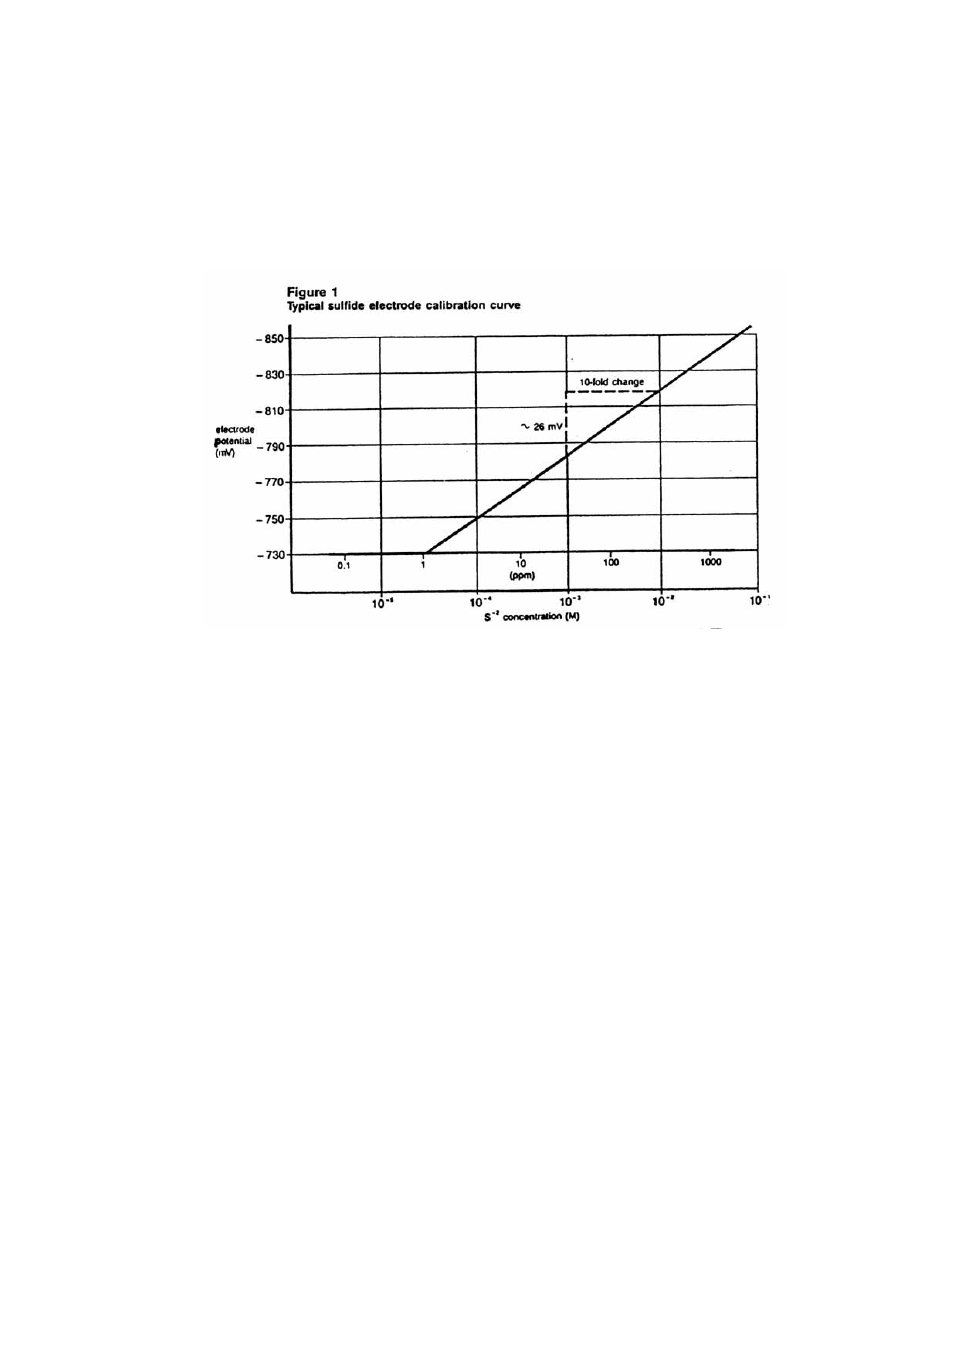
Using the semi-logarithmic graph paper, plot the mV reading (linear axis) against
concentration (log axis). A typical calibration curve can be found in Figure 1.
A calibration curve is constructed on semi-logarithmic paper when using a
pH/mV meter in the millivolt mode. The measured electrode potential in
mV (linear axis) is plotted against the standard concentration (log axis). In
the linear region of the curve, only three standards are necessary to
determine a calibration curve. In the non-linear region, additional points
must be measured. The direct measurement procedures given are for the
linear portion of the curve. The non-linear portion of the curve requires the
use of low level procedures.
6.
To a clean, dry 150 ml beaker, add 50 ml of the sulfide sample, 25 ml of SAOB, and 25 ml
of distilled water. Place the beaker on the magnetic stirrer and begin stirring. Place the
electrode tips in the solution. When the reading has stabilized, record the mV reading.
Determine the concentration directly from the calibration curve.
7.
The calibration should be checked every two hours. Assuming no change in ambient
temperature, place the electrode tips in the mid-range standard. After the reading has
stabilized, compare it to the original reading recorded in Step 3 above. A reading differing
by more than 0.5 mV or a change in the ambient temperature will necessitate the repetition
of Steps 2-5 above. A new calibration curve should be prepared daily.
Direct Measurement of Sulfide (using an ion meter)
1.
By serial dilution of the weekly standard, prepare two sulfide standards whose
concentration is near the expected sample concentration. Measure out 50 ml of each