Thermo Fisher Scientific Ion Selective Electrodes Calcium User Manual
Page 10
Calcium Electrode
Instruction Manual
10
The progressive and quantitative addition of a reagent to a measured sample until neither active
species (reagent or sample) is in excess. Ion selective electrodes are excellent endpoint detectors
since they are not influenced by solution color or turbidity. Though titration is more time
consuming than direct measurement, it is about 10 times more accurate.
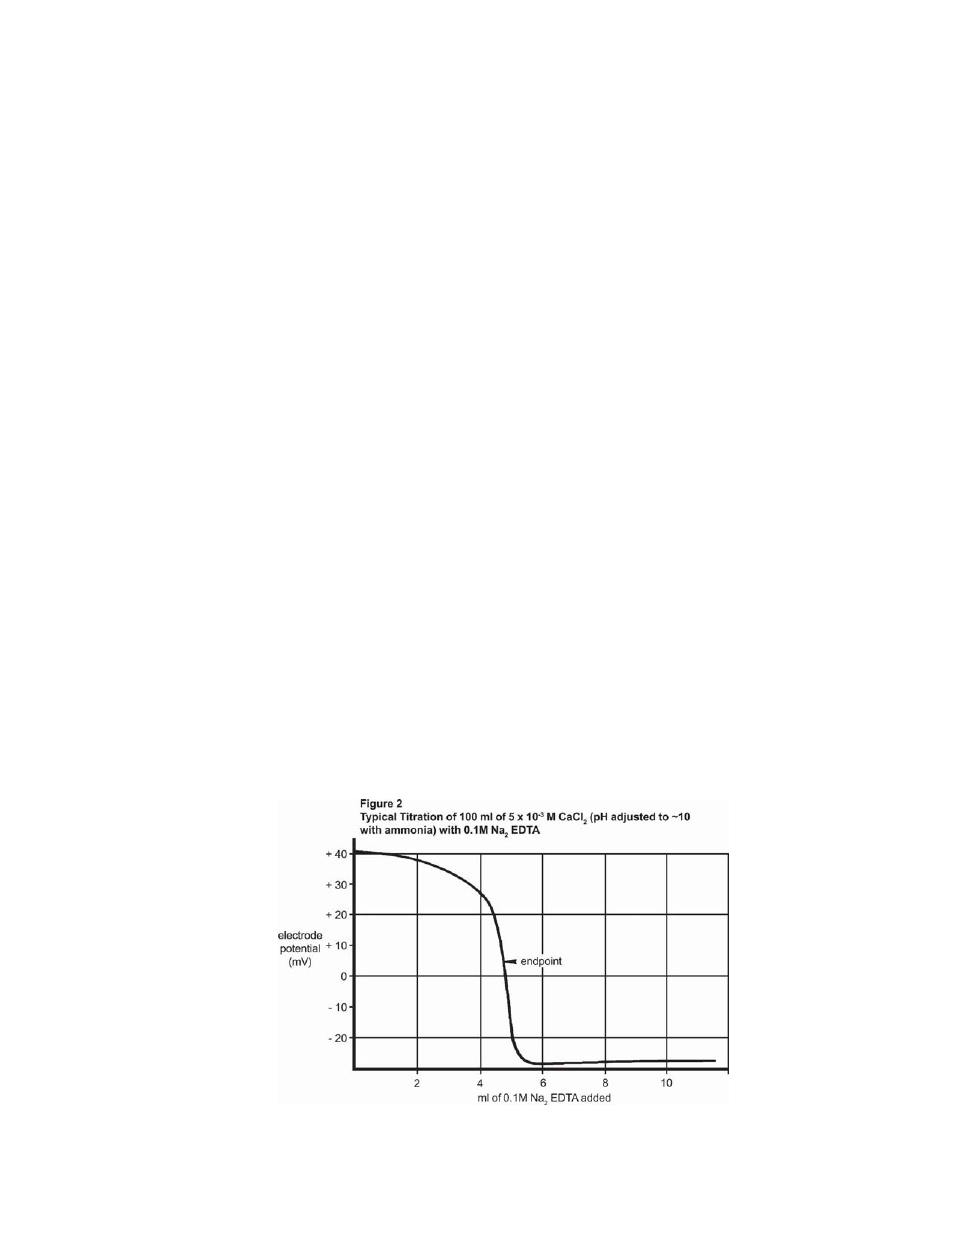
Titration of Calcium
The method outlined in this section makes use of the calcium ion electrode as a highly sensitive
endpoint detector for calcium-containing samples. The titrant used is EDTA.
EDTA complexes calcium as well as other cations. The sample pH can be adjusted to pH 10 by
adding ammonia to eliminate unwanted ion complexes. Masking agents can be added in some
cases.
1.
Soak the calcium ion electrode tip in 10
-3
M or 100 ppm calcium standard solution for a
minimum of one hour prior to use.
2.
Prepare the stock EDTA titrant as given in the section
Required Solutions
. Dilute the
EDTA to 10 to 20 times as concentrated as the suspected sample concentration. The
sample should contain at least 1.0X10
-3
M calcium for a good detection of the endpoint.
3.
Fill a 50 ml buret with the EDTA solution. Pipet 100 ml of the sample into a 150 ml
beaker, place the beaker on the magnetic stirrer and begin stirring at a constant rate. Adjust
the sample to pH 10 by adding ammonia.
4.
Position the buret tip in the beaker, slightly above the liquid level in the beaker and slightly
off center. Position the electrode tips in the solution about half way between the center of
the beaker and the beaker wall.
5.
Begin adding the EDTA in 0.5 ml to 1.0 ml increments and about 0.1 ml to 0.2 ml
increments as the potential begins to change more rapidly. Record the mV potential after
each addition. Continue the additions several milliliters past the endpoint.
6.
Plot the milliliters of EDTA added against the mV potential on standard coordinate graph
paper. (See Figure 2). The point of greatest potential change is the endpoint.
7.
The calcium ion concentration from the unknown is calculated as follows.