Band power analysis – Teledyne LeCroy QPHY-UWB User Manual
Page 20
20
QPHY-UWB-OM-E Rev C
BAND POWER ANALYSIS
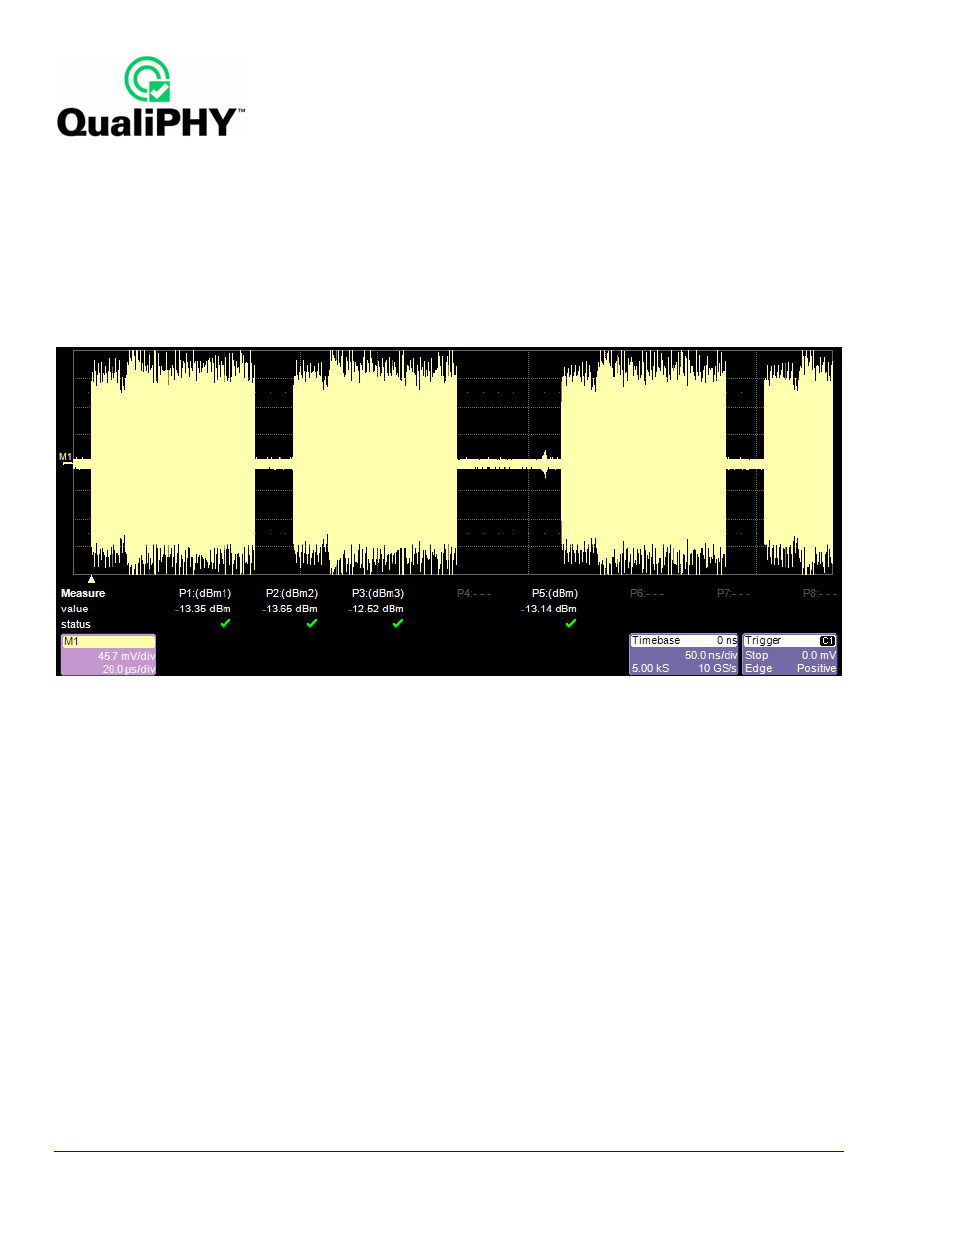
This analysis shows the power of the symbols in each active band, in dBm, in P1, P2 and P3; and the power of all
the symbols in P5. In TFC 5, 6 and 7 only one band is active so only one of P1, P2 and P3 will be shown, and the
value in P5 will be the same as that value because all the symbols were in one band. Similarly for TFC 8, 9 and
10 two of P1, P2 and P3 will be shown.
The parameters are labeled dBm1, dBm2 and dBm3 for the power from symbols in the low, middle and upper
band in the band group; and dBm for the power from all the symbols.
The signal being measured is shown on the grid, above the parameters. The following screen-shot shows power
being measured on a TFC 1 signal.
See also other documents in the category Teledyne LeCroy Software:
- WaveAce EasyScope Operators Manual (28 pages)
- PeRT3 Software Interface (15 pages)
- FireInspector Automation Application Programming Interface (92 pages)
- PETracer ProtoSync Software User Manual (154 pages)
- QPHY-PCIe3-Tx-Rx (32 pages)
- Signal Integrity Studio (14 pages)
- Serial Data Debug Solutions (204 pages)
- Line Code and Symbolic Decoders (20 pages)
- AORM - Advanced Optical Recording Measurements (125 pages)
- CANbus TD - Quick Reference Guide (8 pages)
- CANbus TD and CANbus TDM - Operators Manual (69 pages)
- FlexRay Trigger, Decode and Physical Layer Test (32 pages)
- MIPI D-PHY (15 pages)
- DFP2 - Digital Filter Package 2 (22 pages)
- ET-PMT - Electrical Telecom Pulse Mask Testing (11 pages)
- ENETbusD Decoder (16 pages)
- Eye Doctor II (45 pages)
- JitKit (16 pages)
- JTA2 (31 pages)
- Power Analyzer Package (34 pages)
- QPHY-10GBase-KR (28 pages)
- QPHY-10GBase-T (36 pages)
- QPHY-BroadR-Reach (33 pages)
- QPHY-DDR2 (47 pages)
- QPHY-DDR3 (44 pages)
- QPHY-DDR4 (73 pages)
- QPHY-DisplayPort (19 pages)
- QPHY-ENET (78 pages)
- QPHY-HDMI (37 pages)
- QPHY-LPDDR2 (49 pages)
- QPHY-MIPI-DPHY (32 pages)
- QPHY-MOST150 (24 pages)
- QPHY-MOST50 (21 pages)
- QPHY-PCIe (30 pages)
- QPHY-PCIE3 (28 pages)
- QPHY-SAS2 (45 pages)
- QPHY-SAS3 (50 pages)
- QPHY-SATA (45 pages)
- QPHY-USB (66 pages)
- QPHY-USB3-Tx-Rx (47 pages)
- SDA II (38 pages)
- SDA III-CompleteLinQ (59 pages)
- Spectrum Analyzer (14 pages)
- USB2 Decoder (24 pages)