Qphy-uwb software option – Teledyne LeCroy QPHY-UWB User Manual
Page 13
QPHY-UWB Software Option
QPHY-UWB-OM-E Rev C
13
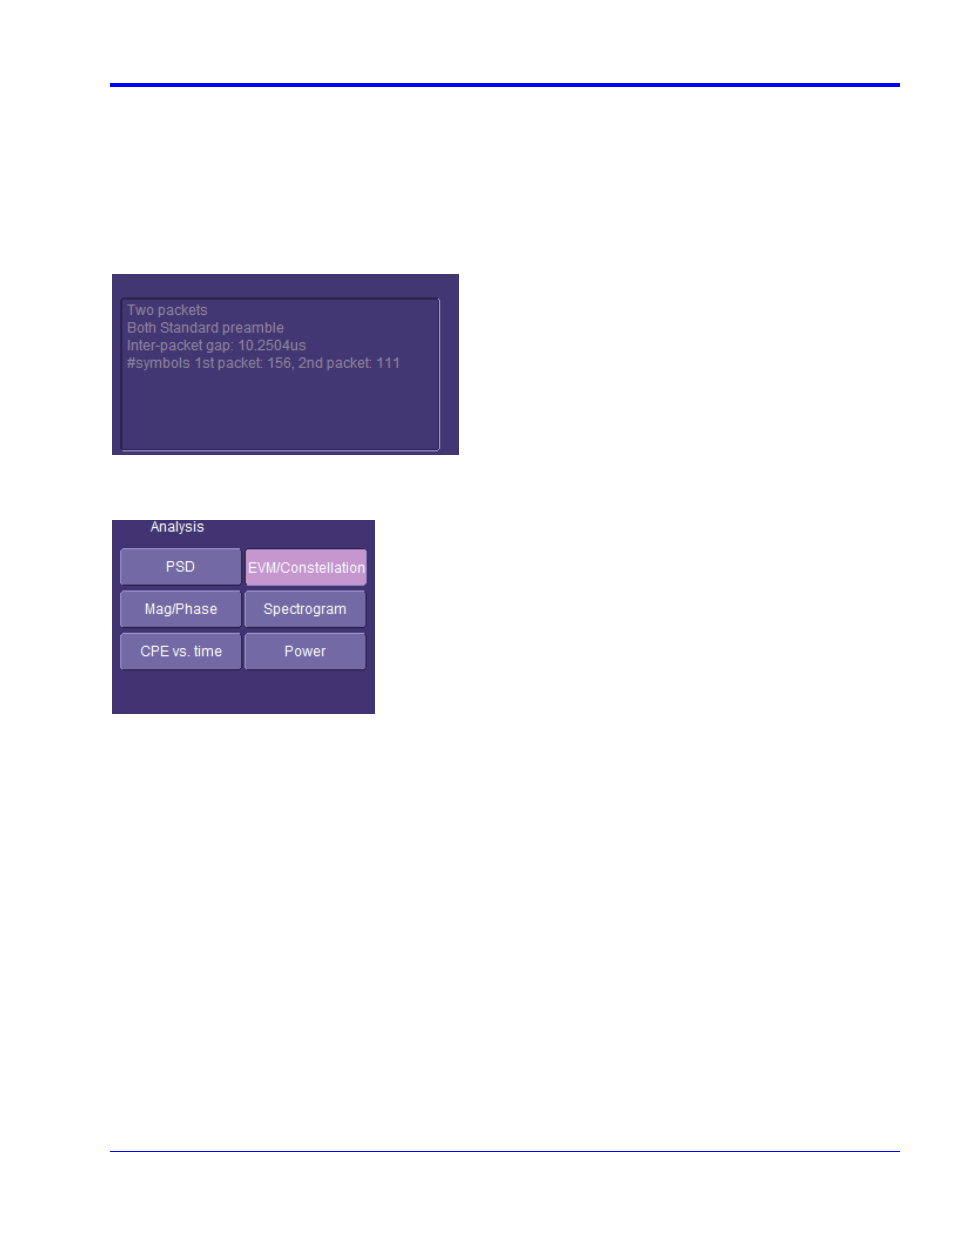
Interpreting the Packet Information Box
This box located to the right of the UWB Analysis main menu outputs useful information on the signal being
analyzed:
•
Number of packets displayed
•
Preamble information
•
Inter-packet gap time
•
Number of symbols contained in each packet displayed
Selecting the Analysis View and Associated Menus
Select one of the analysis buttons to bring up the view and controls for that type of analysis.
There are 6 possible analysis types:
•
PSD - Power Spectral Density
•
EVM/Constellation - Error Vector Magnitude (EVM) with Constellation display
•
Mag/Phase - Magnitude and Phase plots
•
Spectrogram – Spectrogram plot
•
CPE vs. time - Common Phase Error (CPE) versus time
•
Power – Total power in packet and the power in each band
When one of the analysis views is selected, an additional menu is created and brought forward which contains the
controls for that particular analysis view. We can hop back and forth between this particular analysis view menu
and the main UWB control menu by selecting the appropriate tab at the top left of the menu area. For example,
when the Spectrogram analysis is active, the 2 menu selection tabs are called Spectrogram and UWB Analysis
(See picture on next page). The UWB Analysis tab is always available to allow you to jump back to the main
UWB menu.