Sample gas pump, 0 control system, System power – Perma Pure Micro-GASS UG-1212 User Manual
Page 10: Filter temperature control, Dryer temperature control
Sample Gas Pump
The sample gas pump draws sample gas from the source, through the dryer and analyzer. By
generating a vacuum in the process, it serves to create the proper conditions for the sample gas
to be used as the purge gas. The pump has a capacity up to 1 lpm and is made from materials
highly resistant to chemical attack.
2.0 Control System
System Power
The system power switch controls power to the temperature controller, filter heaters, and dryer
heaters, System power is on a 2 Amp fuse, located on the control panel. The heated-line
connector is directly connected to the AC power input terminal bock. As a result, the power
switch does not interrupt power to this circuit. There is a 10A inline fuse in this circuit.
Pump Power
Pump power is enabled by the temperature controller when the system reaches the operating
temperature setpoint. With the switch in the ON position, the pump will automatically turn on
when the dryer temperature reaches setpoint. This allows the pump to draw the wet sample into
the system only when the system is ready.
Filter Temperature Control
The particulate filter is thermostatically controlled via a solid state relay and pad style heaters
that are attached to the aluminum housing that surrounds the filter. The setpoint is fixed at 100C
and does not require adjustment.
Dryer Temperature Control
The Nafion® membrane dryer temperature is monitored and controlled by an electronic
temperature controller via a solid state relay and pad style heaters. A type K thermocouple is
used to sense the temperature. The setpoint temperature range is from 35
O
C to 65
O
C.
Flow Control
– Sample gas flow is measured and controlled by a float type rotameter after
it returns to the MicroGASS. The flow meter should be adjusted to provide a flow of between 0.5
to 1.0 lpm for optimal performance of the system.
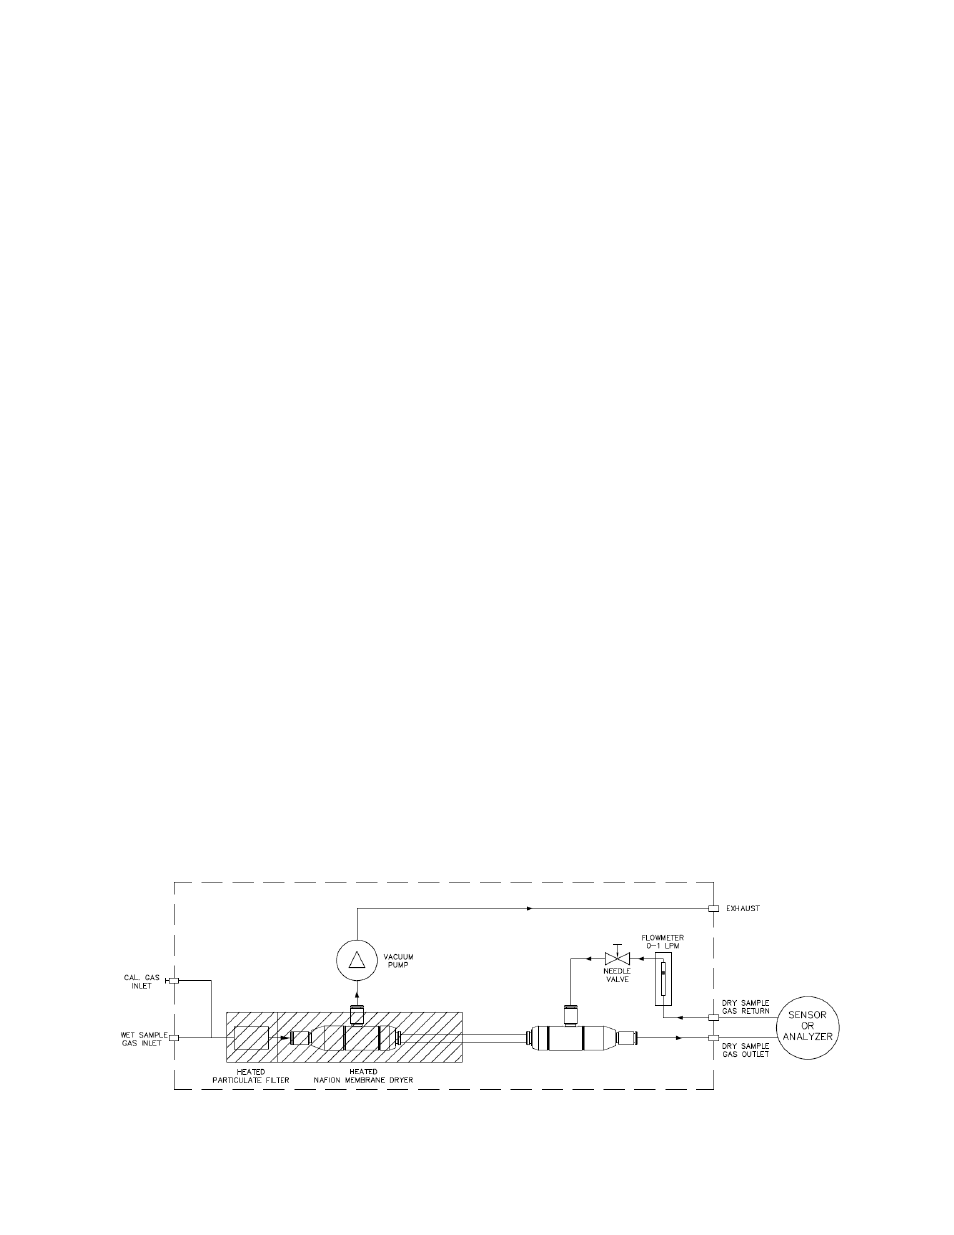
Figure 1- Flow Diagram
10