Mixture map – MoTeC Interpreter User Manual
Page 24
22 Analysis
Tools
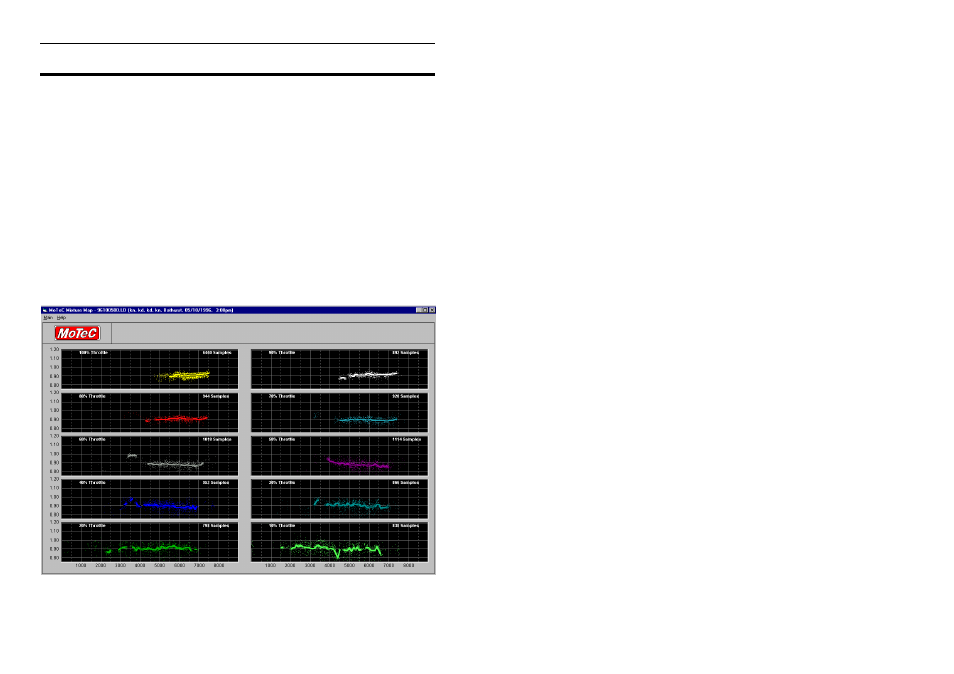
Mixture Map
The mixture map function allows the user to analyze exhaust gas mixture
strengths, over a wide range of load and rpm, to properly establish the
optimum mixture strength for all operating conditions. It does this by taking
individual mixture readings and providing a trend averaging function with or
without filtering for all load points.
The load sites are automatically calculated based on the minimum and
maximum loads logged during that session. For throttle-based engines this is
typically zero to 100% of throttle position. For pressure-based engines, ie:
turbo-charged or super-charged engines, this tends to be minimum manifold
pressure to maximum manifold pressure with ten equal graduations within
that range.
The display can be as either separate graphs for each load point, or a
combined graph showing all load points and trend lines together. This and
other display options are selected under the ‘Preferences’ item of the ‘Main’
menu.