Sequence mode, Analysis function, Highest accuracy – Atec Tettex-MIDAS-288x Series User Manual
Page 3
C
Haefely has a policy of continuous product improvement. Therefore we reserve the right to change design and specification without notice.
LL_MIDAS288x_0711_LW - 3/6
a brand of
Haefely is a subsidiary
of Hubbell Incorporated.
SEQUENCE MODE
Executable test sequences (step macros) can be defined
with
Set-ups:
Set all configuration values, type of DUT,
insulation type, temperature correction function, limits,
work order, serial numbers, test personal, location, etc.
Test levels:
Set the desired different test levels (voltage
and frequency).
Connections:
Set the different connections (DUT wiring)
e.g. GSTg A+B.
Measuring values:
Define the different values to be
recorded. E.g. Voltage, Frequency, PF, Current, Insulation
Temperature, PF@20°C, etc.
Test instructions:
In every step that requires a rewiring
of the test object an instruction box with text and pictures
can be defined to provide the test personal with a step by
step guide of how to perform the connection, wiring and
the test.
Pass/fail levels:
Limits can be set absolute or relative
(based on reference measurements) that will be compared
with the measured values and shown in the analysis
diagram.
All this can be done on the MIDAS itself or with the office
software package on a separate PC or laptop.
A predefined test sequence then can be performed by
lower skilled or educated personal. It reduces the set up
time in the field and also reduces failures due to lack of
knowledge, wrong connections or misinterpretation of
measuring values.
The pop-up test instruction window with a connection diagram
picture and below the corresponding instruction text
The Sequence mode is the perfect tool to repeat
maintenance measurements. If you have already done one
complete measurement you can reload it, perform an
identical test, collect the additional measurements and
display the new trending. As easy as that!
ANALYSIS FUNCTION
As an immediate on-site assessment you can compare the
latest measurements with stored data sets and see how the
insulation values have changed (trending), using the
analysis diagram. Also comparison of measurements
captured at different voltages and different frequencies can
be observed.
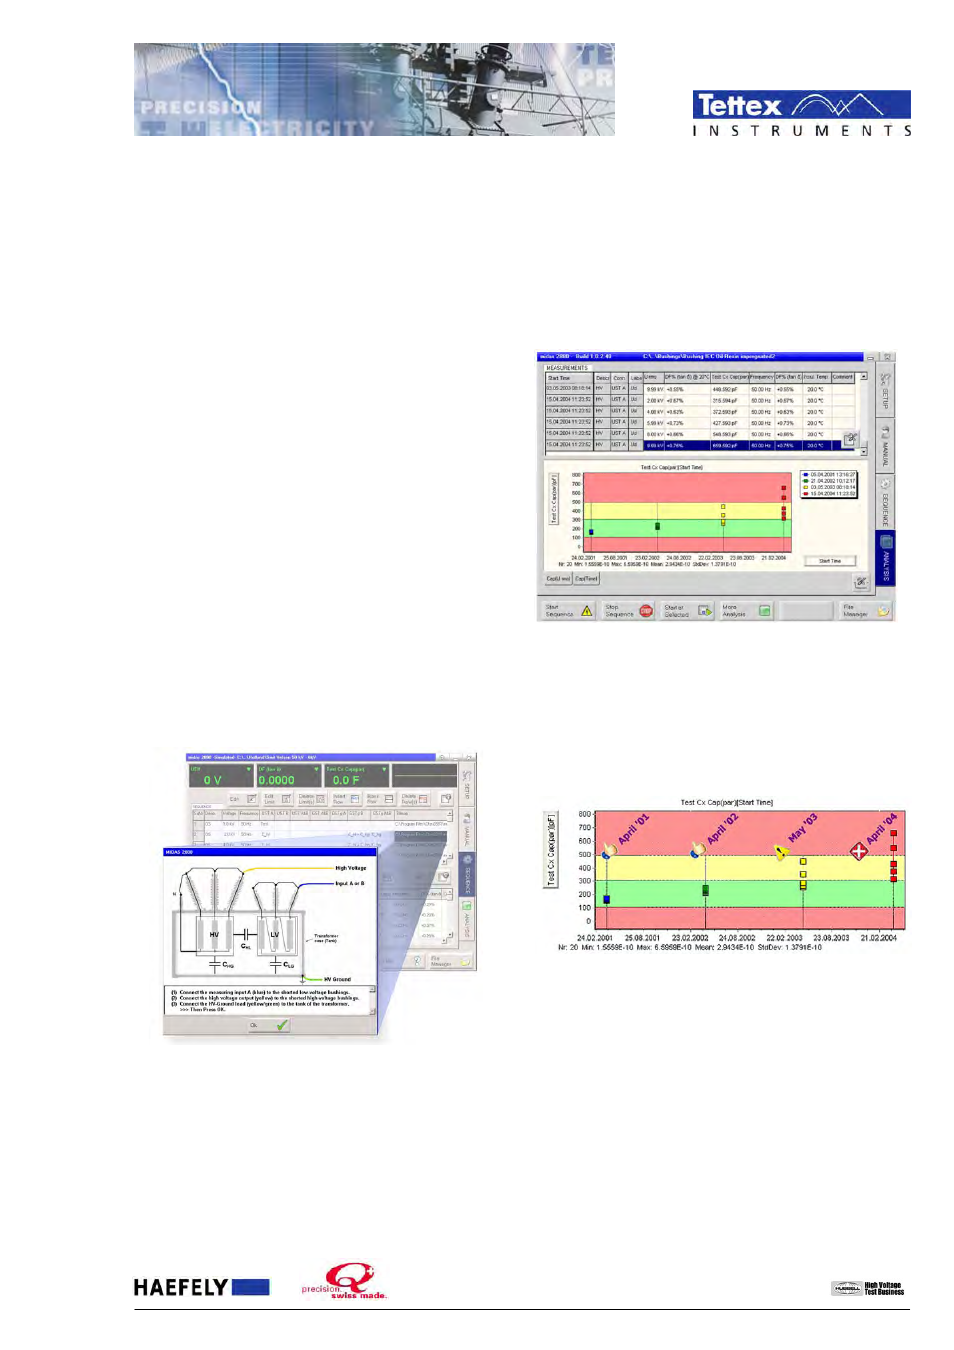
The ANALYSIS window with the list of stored measurements (top)
and the corresponding diagram window (bottom)
Both axis of the analysis diagram are free definable and the
collected sets of different measuring data can be sorted as
selected. So almost any dependency can be shown and
displayed.
If the Pass/Fail criteria are set they are shown in the
diagram as a green “Pass” band, a yellow “Attention”
band and a red “Failed” section. So you can immediately
identify a possible problem in your insulation.
The ANALYSIS diagram shows the trending and the limits.
HIGHEST ACCURACY
Due to the technology used for this advanced test
equipment we reached the highest accuracy in the market.
The
built-in reference is a standard gas capacitor
,
developed in-house, proven over 60 years, used as a
calibration standard for high voltage laboratories and
metrology national institutes. This guarantees the highest
long-term stability unbeaten by any other reference
standard. Because of the design of our standard capacitor,
the stability and the accuracy is independent of the
temperature, air pressure and humidity of the environment
so there is no need for additional verification. It’s all built-in
already and all calibrations are done automatically as part
of the self-test at boot-up. That’s our interpretation of
“accuracy by design”.