Analysis tools, Report generation – Atec Tettex-FRA5310 User Manual
Page 2
Haefely has a policy of continuous product improvement. Therefore we reserve the right to change design and specification without notice.
LL_FRA5310_0711_RF – 2/3
a brand of
Haefely is a subsidiary
of Hubbell Incorporated.
Previously stored curves are accessed using the History tab
sheet, where information can be edited and updated at a
later date.
Automatic Test Setting (Sequence)
Analysis page with limits set according to the standards
A complete transformer test measurement list (sequence) can
be predefined and executed automatically when required,
making it simple to repeat a previous fingerprint
measurement, even if the operator has no previous
knowledge of the setup.
ANALYSIS TOOLS
The analysis system allows multiple stored measurements
to be loaded for detailed analysis, comparison,
verification, reporting, etc.
The measured transfer function curves can be displayed as
Magnitude [dB], Phase [°], Impedance [] ,
Admittance [S] and Ratio.
Additional comments can be stored with the single
analysis displays so expert interpretation and
assessments, further test instructions, etc can be included.
Various
display tools
are easily accessible from the touch
screen to allow simple analysis: Zoom-in and -out, auto
scaling, linear and logarithmic scaling, curve shifting,
measuring point labels, save as meta-file, printout, title
editing, setup information editing, frequency band display,
etc.
Two frequency response curves and their difference.
Cursors
can easily be placed anywhere on the displayed
curves giving the user information down to the last
measuring point.
Differences
of curves with a definable limiter function
can be calculated allowing parts of the curve to be
weighted and highlighted to help the engineer's decision-
making.
Coherence
between two or more curves can be
calculated to give the engineer a powerful tool for the
assessment and comparison of transformer transfer
curves yielding valuable additional information.
Transfer functions of 3 phases and their coherence.
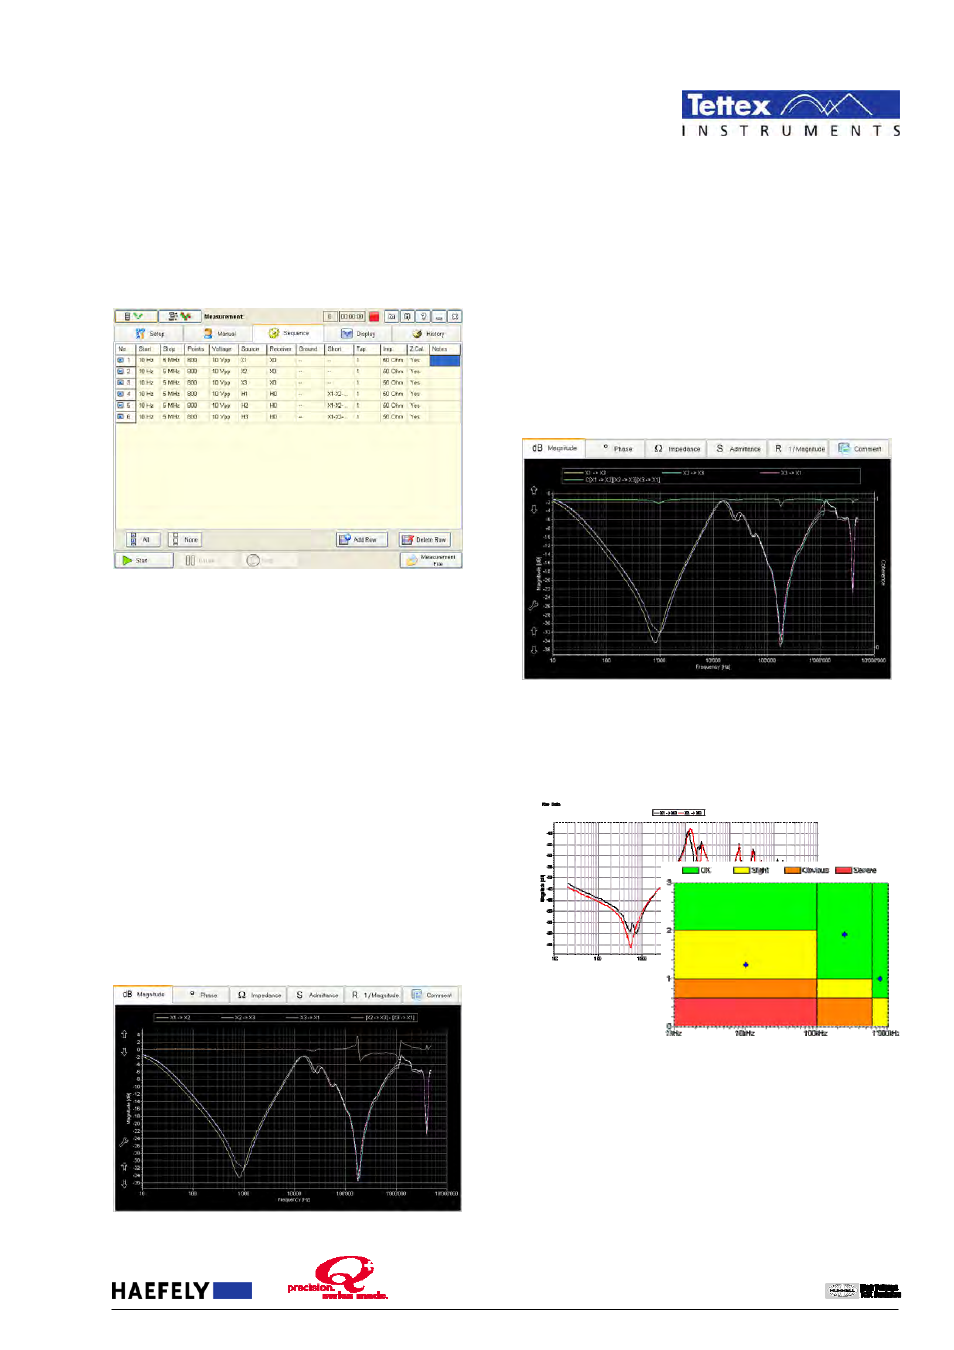
Interpretation
according to Chinese Standard DL / T 911 -
2004 is supported. This interpretation is based on the
comparison of two curve, identifies slight, obvious and severe
mechanical changes and differentiate between typical origins
of the damage.
Comparison of two transfer functions according to Chinese
Standard DL / T 911- 2004.
REPORT GENERATION
The measured frequency response curves (raw data) are
stored in a measuring data file together with all the related
transformer nameplate data and other additional information.
Reports can be created from the measured data file (raw data
curves) or from any analysis data files previously created.