Atec Megger-PA9Plus User Manual
Page 4
PA9PLUS
Portable Power Quality Analyzer
n
Trending – Out-of-limits reports, RMS values, frequency,
unbalance, demand, and energy
Complete Reports
Megger MEGPA9IEC provides comprehensive reports of the
recorded data which can be viewed, printed, or exported to
popular word processing or spreadsheet programs.
n
Summary and Setup Report lists the instrument setup
information, overall data summaries, and forecasts
projections of future power and energy needs.
n
Tabular Report: Power – includes “all” power and energy
data recorded for each phase and total, as well as voltage
and current imbalance.
n
Weekly Energy Report – a powerful, totalized summary
and analysis of any power/energy parameter over every
hour of every day for a week.
n
Tabular Report – Voltage and Current includes all
trended true RMS minimums, maximums, and averages
throughout the test.
n
Total Harmonic Distortion (THD) Summary Report
includes the THD for each input as a percentage of
fundamental for the first cycle of each waveform capture
snap shot.
n
Out of Limits Report details the specifics of every
measured input during an event, as well as the exacting
event type and duration.
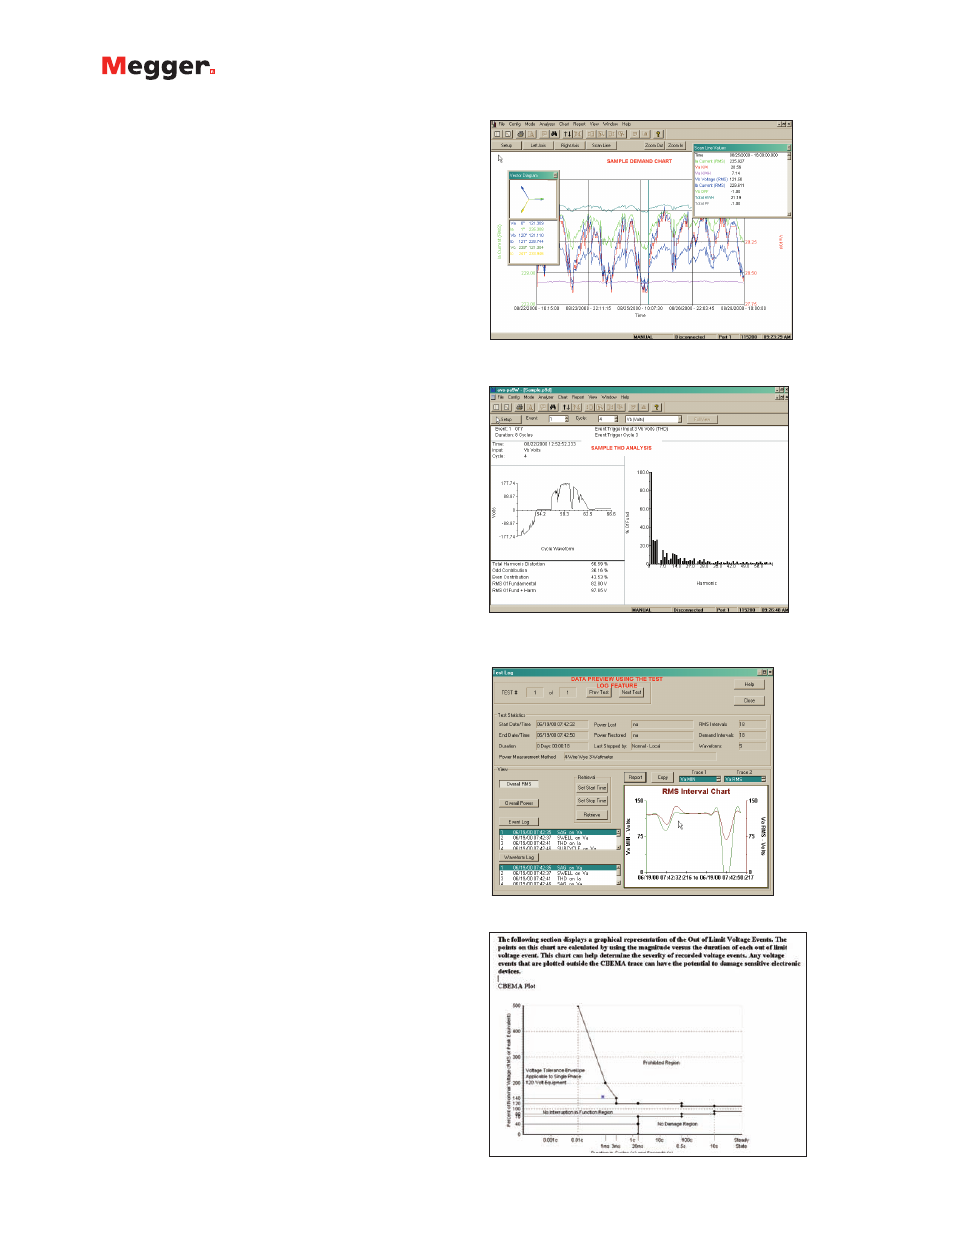
Detailed Charts
Megger MEGPA9IEC allows you to graph and overlay any
or all recorded parameters on a single chart. This feature
dramatically reduces the time for problem analysis and
identification. An important feature allows you to zoom
in/zoom out of particular windows, as well as to copy
and paste data directly from the chart to a third-party
spreadsheet, database, or analysis program. The scan-line
feature provides exacting data and timing information
at any particular point in the chart, thus removing all
guesswork and approximation in the investigation. In
addition, you can graphically view vector information and
relationships for any demand interval, as well as modify the
look of the chart axis and title information. All charts and
graphs may be printed directly to your local or network
printer, and copied and pasted to third-party applications.
NEW ADVANCED METREPORT UTILITY
For more sophisticated reporting requirements, our
optional METREPORT software creates tailored reports and
customized reporting templates. This utility directly reads
power quality data files, producing sophisticated reports
incorporating company specific logos, in-depth charts,
and applicable text into a Microsoft
®
Word-compatible
document. New charting capabilities have been added
for correlating recorded power quality data to industry
manufacturers tolerance curves such as CBEMA, ITIC,
and SEMI-F47. These reports are ideal for professional
presentation to utility customers, power quality clients, and
senior management.
Demand Data Chart
Cycle Waveform with Bar Chart
Selective Data Download and Preview Capabilities
Comparison to industry tolerance curves using optional METRE-
PORT software