Maximum ratings, Thermal characteristics, Electrical characteristics – Diodes 3.0SMCJ5.0A /14A /20A /22A /24A /28A /30A /58A User Manual
Page 2
3.0SMCJ5.0A /14A /20A /22A /24A /28A /30A /58A
Document number: DS30818 Rev. 12 - 2
2 of 4
April 2014
© Diodes Incorporated
3.0SMCJ5.0A /14A /20A /22A /24A /28A /30A /58A
Maximum Ratings
(@T
A
= 25°C, unless otherwise specified.)
Single phase, half wave, 60Hz, resistive or inductive load.
For capacitive load, derate current by 20%.
Characteristic
Symbol
Value
Unit
Peak Pulse Power Dissipation (Note 5)
P
PK
3000 W
Peak Forward Surge Current, 8.3ms
Single Half Sine Wave Superimposed on Rated Load (Notes 6 & 7)
I
FSM
300 A
Thermal Characteristics
Characteristic
Symbol
Value
Unit
Operating and Storage Temperature Range
T
J
, T
STG
-55 to +175
°C
Electrical Characteristics
(@T
A
= +25°C unless otherwise specified.)
Part Number
Reverse
Standoff
Voltage
Breakdown
Voltage
V
BR
@ I
T
(Note 8)
Test
Current
Max. Reverse
Leakage
@ V
RWM
Max
Clamping
Voltage
@ I
PP
Max Peak
Pulse
Current
I
PP
Typical Total
Capacitance
(Note 10)
Marking
Code
See Notes 1 & 9
V
RWM
(V)
Min (V) Max (V)
I
T
(mA) I
R
(
μA) V
C
(V)
(A)
C
T
(pF)
3.0SMCJ5.0A 5.0
6.40
7.07 10 1000 9.2 326.1 8,000 HDE
3
.
0SMCJ14A 14.0
15.60
17.2
1.0
5.0
23.2 129.3 3,500 HEK
3.0SMCJ20A 20.0
22.20
24.5 1.0
5.0
32.4 92.6 3,300 HEV
3.0SMCJ22A 22.0
24.40
27.0 1.0
5.0
35.5 84.5 3,000 HEX
3.0SMCJ24A 24.0
26.70
29.5
1.0 5.0 38.9 77.1 3,000 HEZ
3.0SMCJ28A 28.0
31.10
34.4 1.0
5.0
45.4 66.1 1,800 HFG
3.0SMCJ30A 30.0
33.30
36.8
1.0 5.0 48.4 62.0 1,700 HFK
3.0SMCJ58A 58.0
64.40
71.2 1.0
5.0
93.6 32.1 1,500 HGG
Notes:
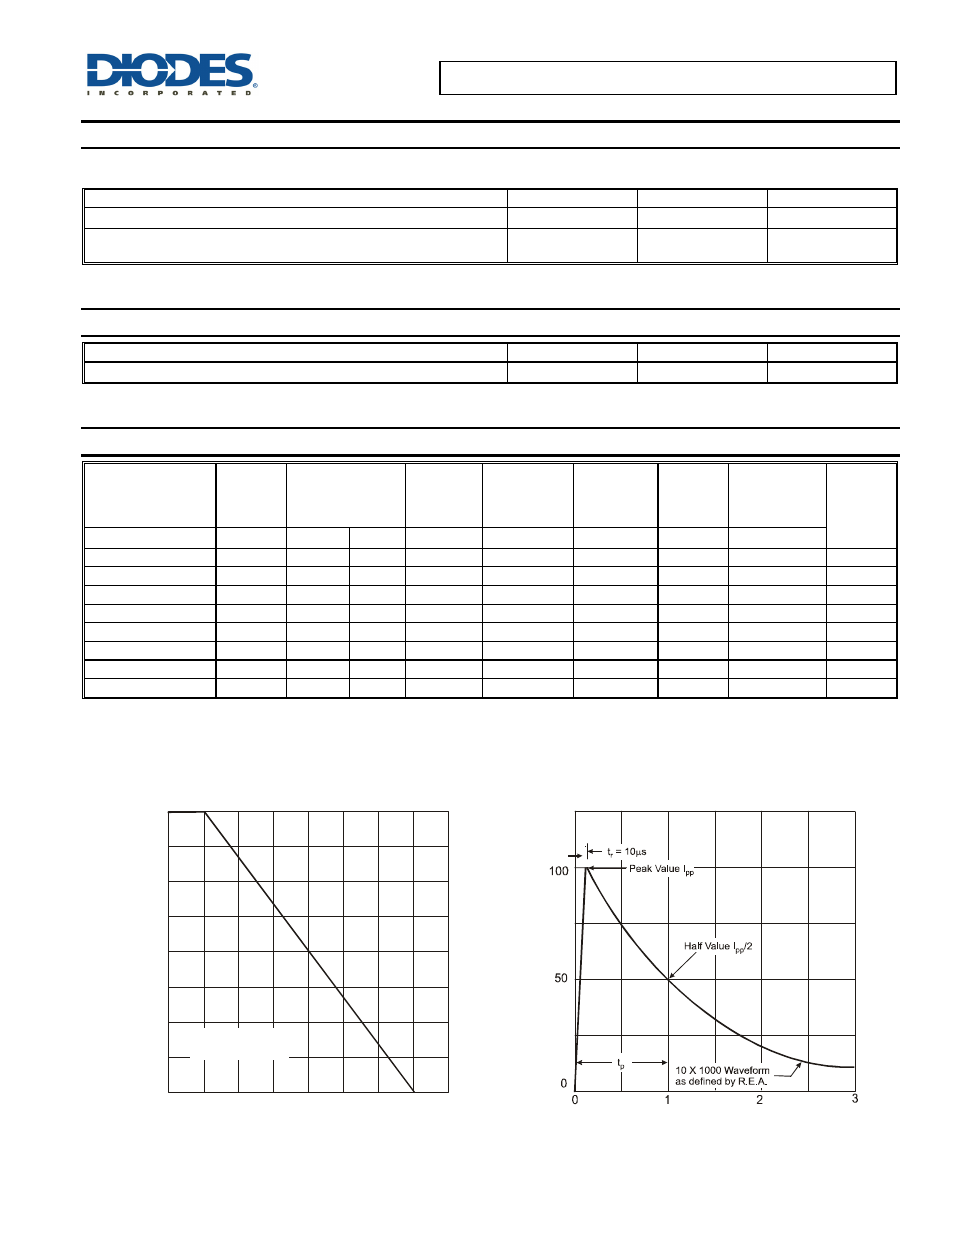
5. Non-repetitive current pulse, per Fig. 4 and derated above T
A
= +25°C per Figure 1.
6. Mounted on 8.00mm
2
(0.013mm thick) land areas.
7. Measured with 8.3ms single half sine-wave. Duty cycle = 4 pulses per minute maximum.
8. V
BR
measured with IT current pulse = 300µs.
9. Additional voltages may be available upon request. Please contact the Diodes Incorporated sales department for assistance.
10. V
R
= 0V, f = 1MHz
10 X 1000 Waveform
as defined by REA
0
25
50
75
100
125
150 175
200
100
75
50
25
0
T , AMBIENT TEMPERATURE ( C)
Fig. 1 Pulse Derating Curve
A
°
P
EA
K
P
U
LS
E
D
E
R
AT
IN
G
I
N
%
O
F
PEAK
PO
W
E
R O
R
CU
R
R
ENT
I
,
PEAK
PU
L
SE CUR
R
E
NT (
%
I
)
PP
p
p
t, TIME (ms)
Fig. 2 Pulse Waveform