Typical performance characteristics – Diodes AP34063 User Manual
Page 7
AP34063
Document number: DS31004 Rev. 6 - 2
7 of 11
September 2012
© Diodes Incorporated
AP34063
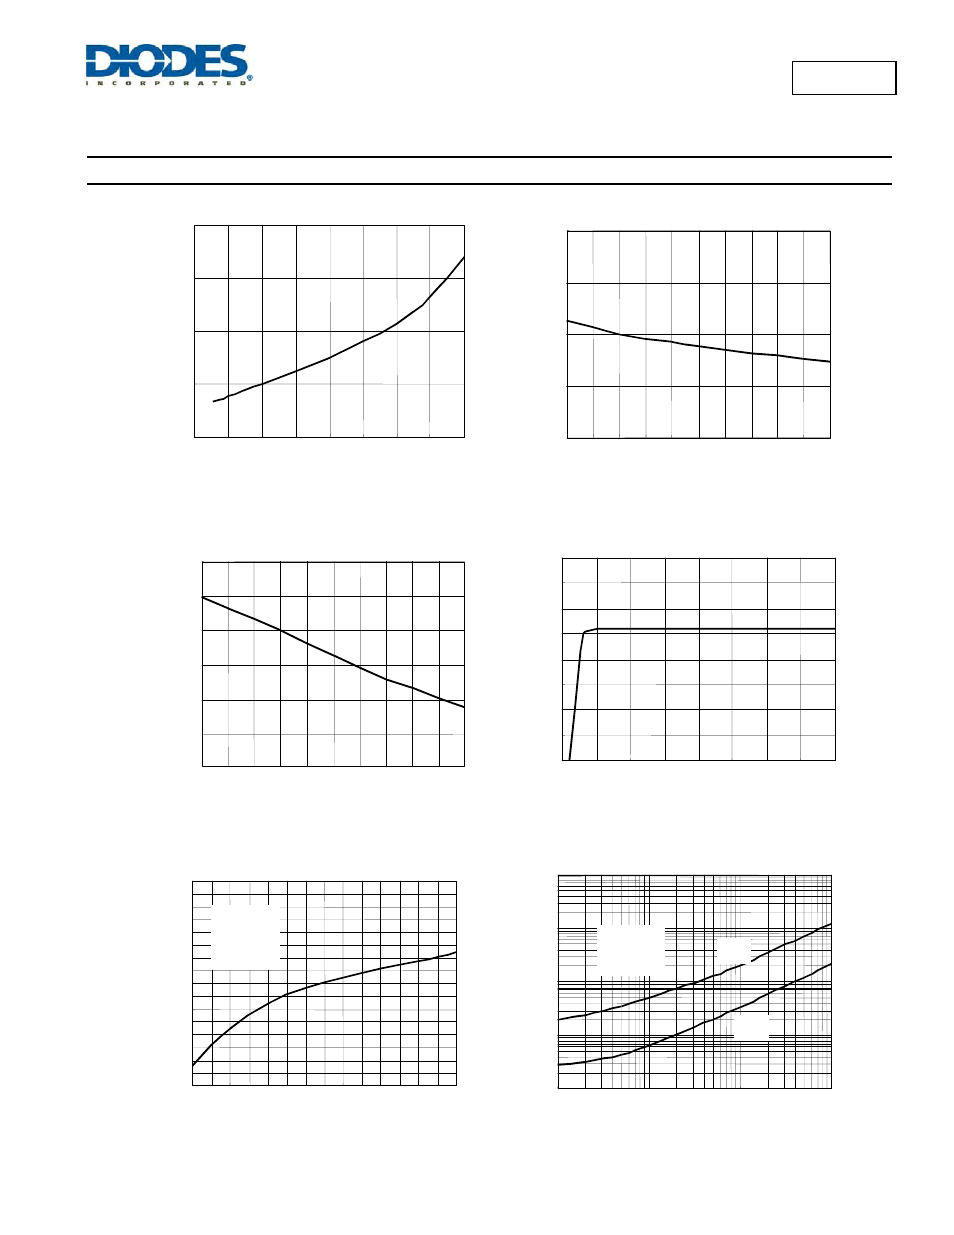
Typical Performance Characteristics
Figure 1. Vce(sat) versus le
0.6
0.8
1
1.2
1.4
0
0.2
0.4
0.6
0.8
1
1.2
1.4
1.6
Ie, Emitter Current (A)
Vc
e
(s
a
t)
, Satu
ra
ti
on
Vol
ta
g
e
(
V
)
1.24
1.245
1.25
1.255
1.26
0
10
20
30
40
50
60
70
80
90
100
Temperature (
o
C)
Re
fe
re
nc
e
V
o
lt
ag
e (V
)
Figure 2. Reference Voltage versus Temp.
Figure 4. Standby Supply Current
versus Supply Voltage
0.0
0.5
1.0
1.5
2.0
2.5
3.0
3.5
4.0
0
5
10
15
20
25
30
35
40
Vcc, Supply Voltage (V)
Ic
c, Sup
p
ly
C
u
rr
e
nt (
m
A)
1.4
1.45
1.5
1.55
1.6
1.65
1.7
1.75
1.8
100
300
500
700
900
1100
1300
1500
I
E
(mA)
V
CE
(
s
at
),
(V
)
Figure 5. Emitter Follower Configuration
Output Saturation Voltage vs. Emitter Current
0.1
1
10
100
1000
0.01
0.1
1
10
C
T
, Oscillator Timing Capacitor (nF)
t
on-of
f
, Ou
tp
u
t Sw
itc
h
On
-O
ff Ti
me
(u
s
)
Figure 6.Output Switch On-Off Time versus
Oscillator Timing Capacitor
V
CC
= 5.0V
Pin 7 = V
CC
Pin 5 = GND
T
A
= 25
o
C
t
on
t
off
Vcc=2~10V
Pin1,7,8=Vcc
Pin3,5=GND
T
A
=25
o
C
Pin2=5
Figure 3. Current Limit Sense Voltage
versus Temperature
320
340
360
380
400
420
440
0
10
20
30
40
50
60
70
80
90
100
Temperature (
o
C)
C
u
rr
e
nt Se
nse
Vo
lt
a
g
e
(
m
V)
≤10W