3 0 applications information – Rainbow Electronics ADC10158 User Manual
Page 21
3 0 Applications Information
(Continued)
TL H 11225 – 23
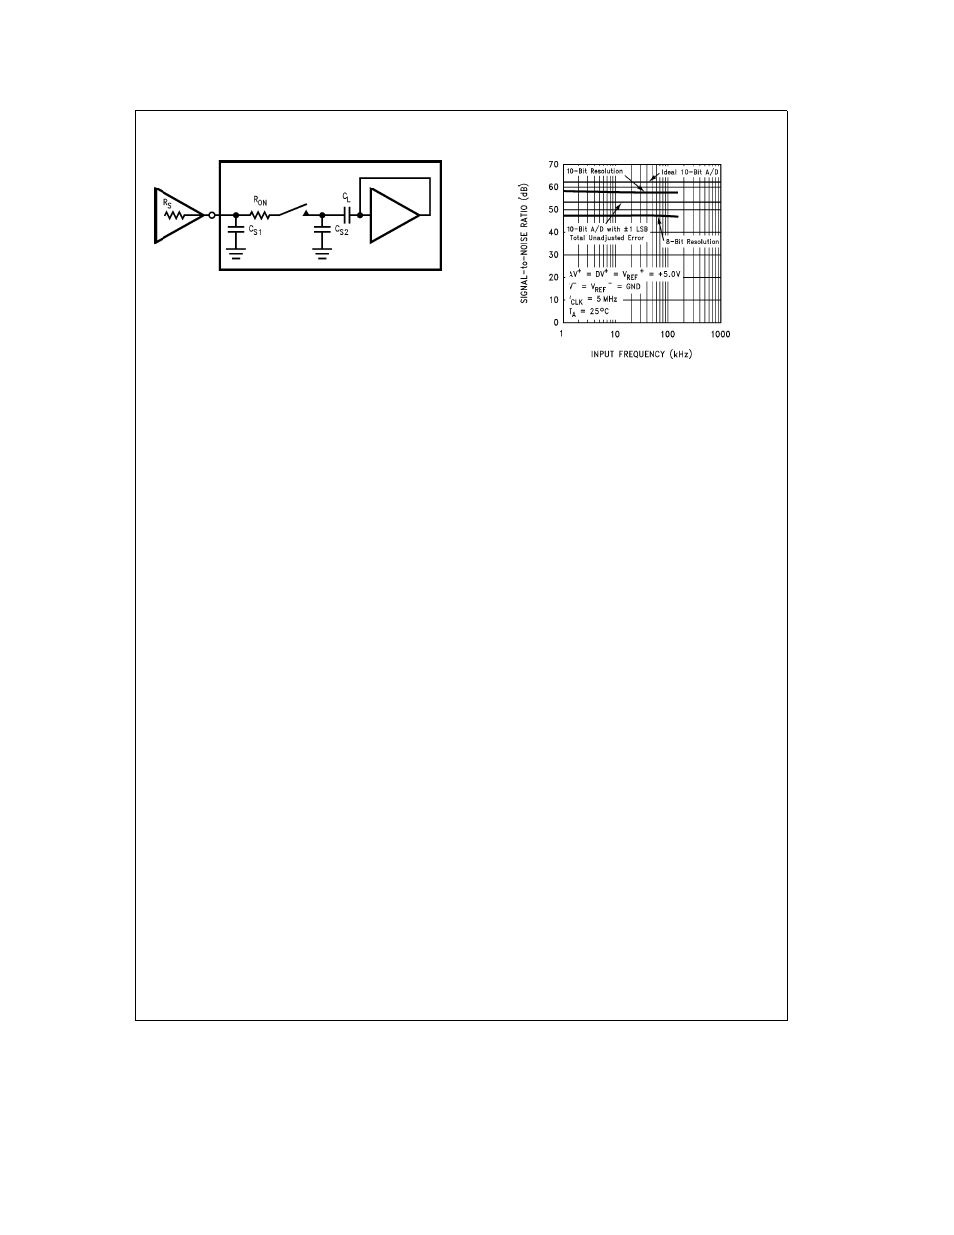
FIGURE 5 Analog Input Model
The curve ‘‘Signal to Noise Ratio vs Output Frequency’’
(Figure 6)
gives an indication of the usable bandwidth of the
ADC10154 ADC10158 The signal-to-noise ratio of an ideal
A D is the ratio of the RMS value of the full scale input
signal amplitude to the value of the total error amplitude
(including noise) caused by the transfer function of the A D
An ideal 10-bit plus sign A D converter with a total unadjust-
ed error of 0 LSB would have a signal-to-noise ratio of about
68 dB which can be derived from the equation
S N e 6 02(n) a 1 8
where S N is in dB and n is the number of bits
Figure 2
shows the signal-to-noise ratio vs input frequency of a typi-
cal ADC10154 ADC10158 with
LSB total unadjusted er-
ror The dotted lines show signal-to-noise ratios for an ideal
(noiseless) 10-bit A D with 0 LSB error and an A D with a 1
LSB error
SNR vs Input Frequency
TL H 11225 – 24
FIGURE 6 ADC10154 ADC10158
Signal-to-Noise Ratio vs Input Frequency
The sample-and-hold error specifications are included in the
error and timing specifications of the A D The hold step
and gain error sample hold specs are included in the
ADC10154 ADC10158’s total unadjusted
linearity
gain
and offset error specifications while the hold settling time is
included in the A D’s maximum conversion time specifica-
tion The hold droop rate can be thought of as being zero
since an unlimited amount of time can pass between a con-
version and the reading of data The data is lost after a new
conversion has been completed
21