Texas Instruments TI-83 PLUS User Manual
Page 382
TI-83 Plus
Statistics
379
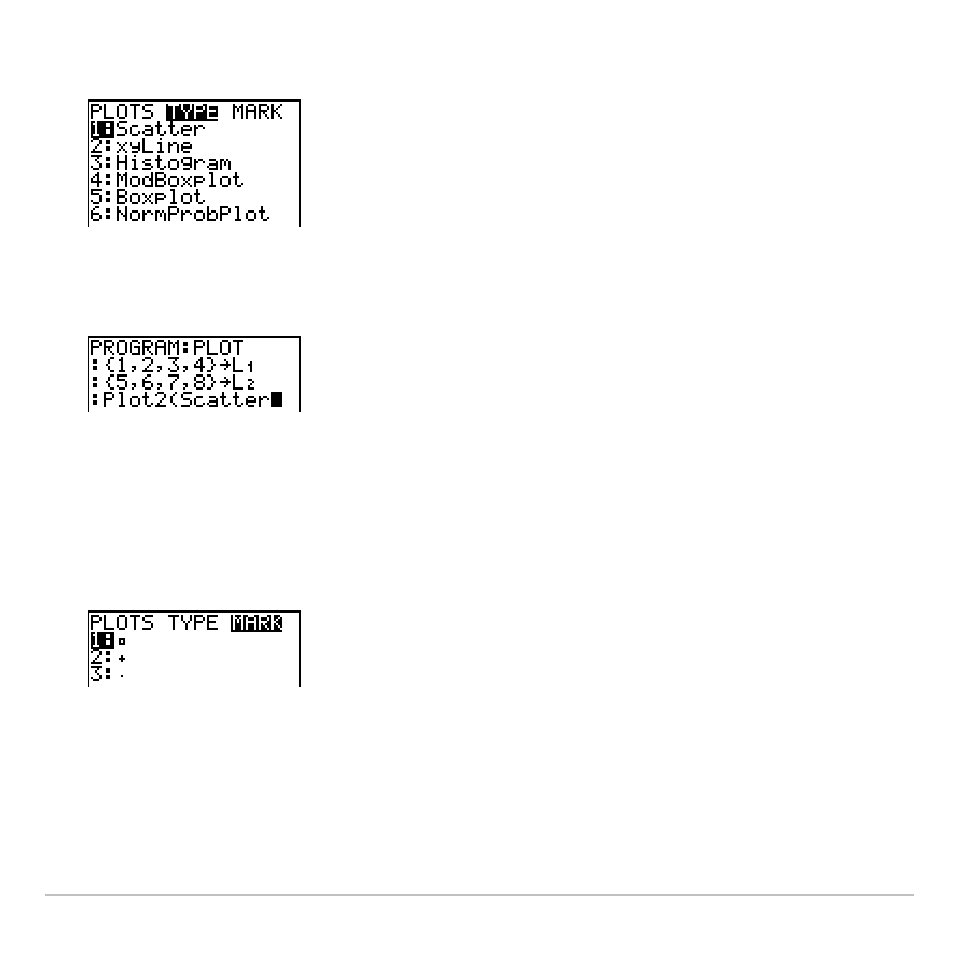
3. Press
y
,
~
to display the
STAT TYPE
menu.
4. Select the type of plot, which pastes the name of the plot type to the
cursor location.
5. Press
¢
. Enter the list names, separated by commas.
6. Press
¢
y
,
|
to display the
STAT PLOT MARK
menu. (This
step is not necessary if you selected
3:Histogram
or
5:Boxplot
in
step 4.)
Select the type of mark (
›
or
+
or
¦
) for each data point. The selected
mark symbol is pasted to the cursor location.
This manual is related to the following products: