Graph view – POLAR CS400 User Manual
Page 12
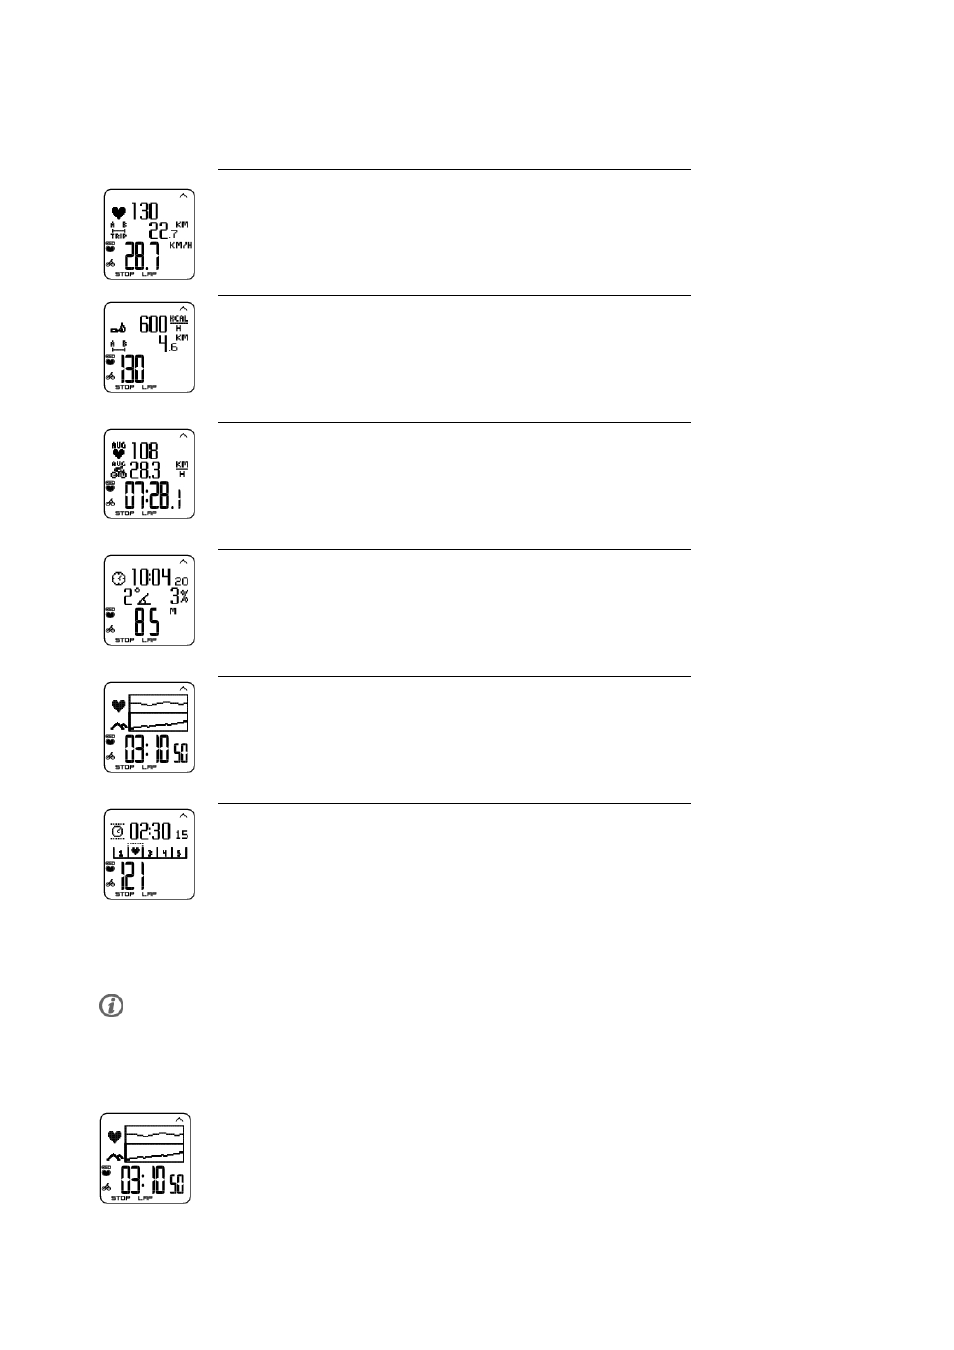
Default Views on Your Display When Using Speed Sensor
Speed
Heart rate
Trip distance
Speed in km/h
Heart Rate
Burned calories/ hour
Trip distance
Current heart rate
Stopwatch
Average heart rate
Average speed
Stopwatch
Altitude
Time of day
Incline
Altitude in meters
Graph
Heart rate graph
Altitude in graph
Stopwatch (Total duration of the exercise so far)
Zonelock
Countdown timer
Zone pointer
Current heart rate
Customize the cycling computer display to show information you want to see. See Personalize the
Cycling Computer Display.
If a cadence sensor is installed, you have a variety of ways to display data.
Graph view
The graph view enables comparison in graphs of two values during exercise. For example, choose a
graphical overview of your heart rate and speed.
The graph view can be customized. For the upper and middle rows, you can choose to view
Speed
,
Altitude
or
Heart rate
in graphs.
Polar CS400 User Manual
12