Sun Microsystems J2ME User Manual
Page 52

40
J2ME Wireless Toolkit User’s Guide • October 2004
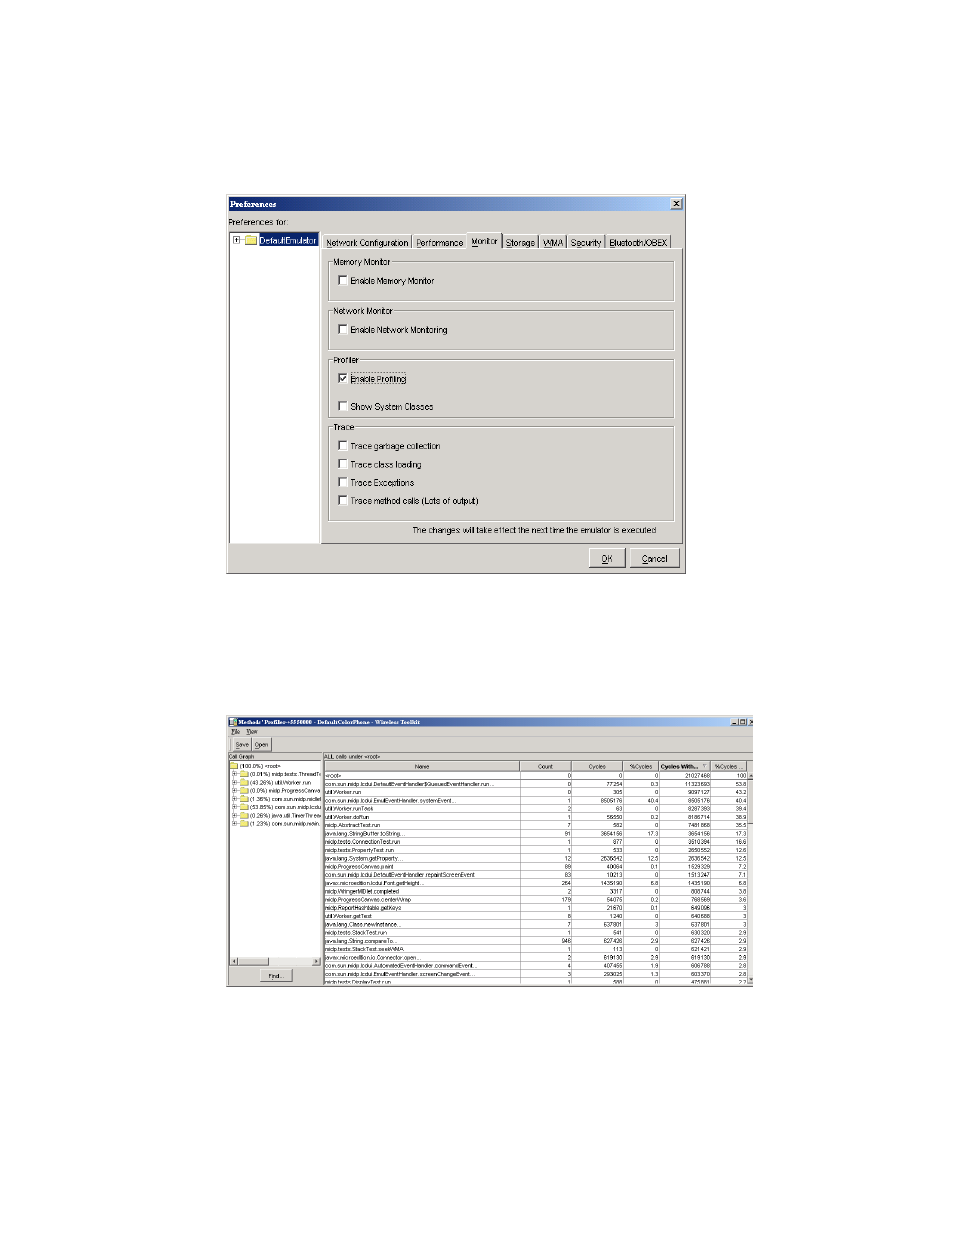
FIGURE 20
Turning on the profiler
Now run your application by clicking on the Run button. Interact with your
application as you normally would. When you’re finished, shut down the emulator.
The profiler pops up with information about all the method calls in your
application.
FIGURE 21
The method profiler
The profiler displays two types of information:
■
Method relationships are shown in a hierarchical list, the Call Graph.
