3 graph display – Furuno CI-68 User Manual
Page 27
2. INTERPRETING THE DISPLAYS
2-7
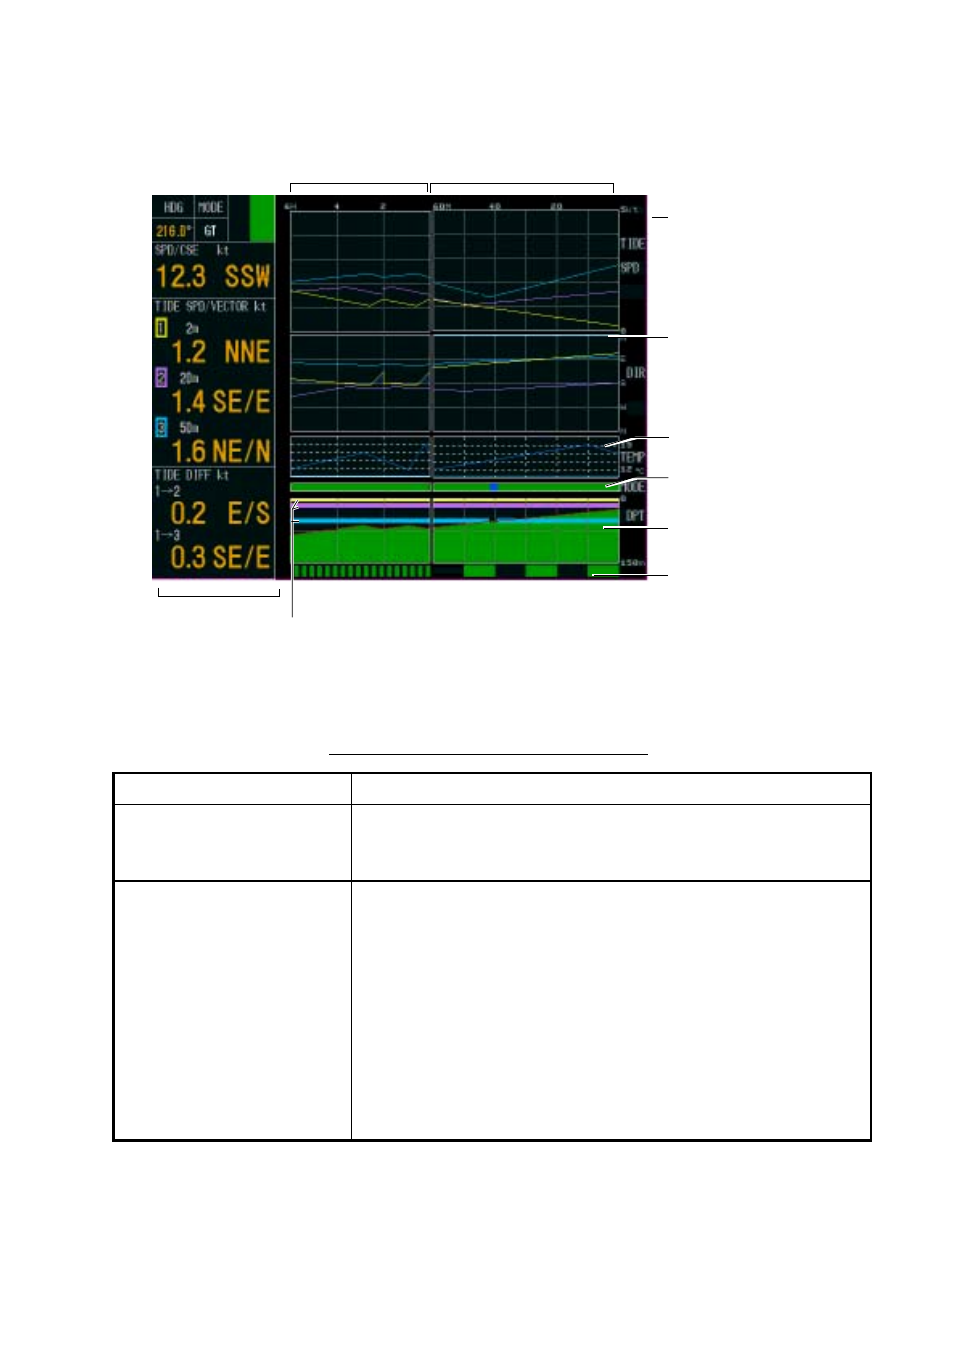
2.3 Graph
Display
0-60 minutes
of latest data
0-6 hours
of latest data
Note: When overlapping occurs,
layer having highest number
has priority.
*: Sensor required.
Text Window
Depth of
each layer
Depth Graph
Mode Marker
Water Temp. Graph*
Tide Graph
(or Tide Diff
or Ship Speed)
Trip Distance
Marker
Max. Range of
Tide Speed
(or Course)
Graph display
Description of graph display indications
Item Description
Text window
The text window may be turned on or off with TEXT WINDOW in
the DISP1 menu. When the text window is turned off, 12 hours of
graph data are shown.
Tide (or tide differential,
speed) graph
You may choose the type of graph to display with MODE in the
DISP1 menu.
The maximum tide speed (or ship’s speed) range may be chosen
with TIDE RANGE in the DISP1 menu.
Tide direction (or course) may be chosen with TIDE GRAPH in the
DISP1 menu.
For the tide graph, graph lines are displayed in colors: Layer 1,
Yellow; Layer 2, Purple, and Layer 3, Light-blue.
For the tide differential graph, the tide differential between layers 1
and 2 is shown in purple and that between layers 1 and 3 in
light-blue.