3 shifting the display, 4 chart scale, 5 chart cards – Furuno color video plotter GD1720C User Manual
Page 80: 1 chart card overview
3. PLOTTER OPERATION
3-9
3.3 Shifting the Display
The plotter display can be shifted as below.
1. Use the Cursor pad to locate the cursor at a screen edge. The screen shifts in the
direction opposite of cursor location.
2. To turn off the cursor, press the CENTER soft key. This also returns the own ship
marker to the screen center.
3.4 Chart
Scale
Chart scale (range) may be selected with the [RANGE -] or [RANGE +] key. The [-] key
shrinks the chart range (image is expanded); the [+] key expands the cart range (image is
shrunk). The available ranges are as below.
Charts scales
nm
0.125
0.25
0.5
1 2 4 8 16 32 64
128
256
512
1024
2048
*
km 0.23 0.46 0.93 1.85 3.70 7.41 14.8
29.6
59.3
119
237
474 948 1896
3792
sm 0.144 0.29 0.58 1.15 2.30 4.60 9.21
18.4
36.8 73.7
147
295 589 1178
2356
*: 2046 or 2047 in high latitudes.
3.5 Chart
Cards
3.5.1 Chart card overview
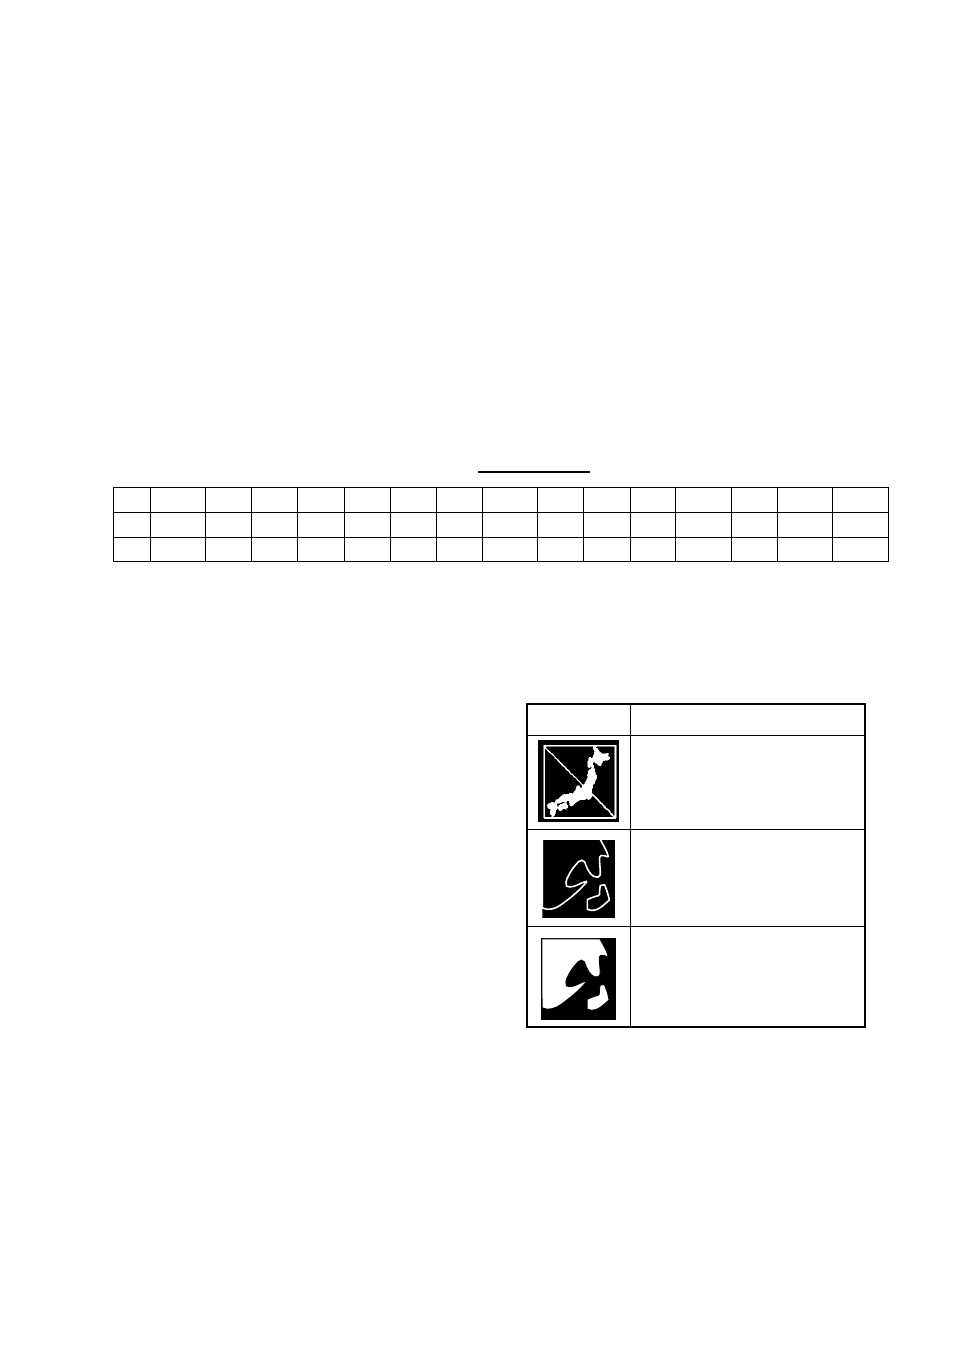
Your system reads NAVIONICS GOLD or
C-MAP NT MAX charts, depending on the
type of display unit you have.
When you insert a suitable chart card in
the slot and own ship is near any
cartographic object, a chart appears. If a
wrong card is inserted or a wrong chart
scale is selected, landmasses will appear
hollow. Chart icons appear at the top of the
display to help you select a suitable chart
scale. The table below shows the chart
icons and their meanings.
Icon
Meaning
Chart scale is too large.
Operate the RANGE key to
adjust chart scale.
Suitable chart scale is
selected.
Proper card is not inserted or
chart scale is too small. Press
the ZOOM IN soft key to adjust
chart scale.
Chart icons and their meanings