Canary times – HP ProLiant DL585 G5 User Manual
Page 13
Canary times
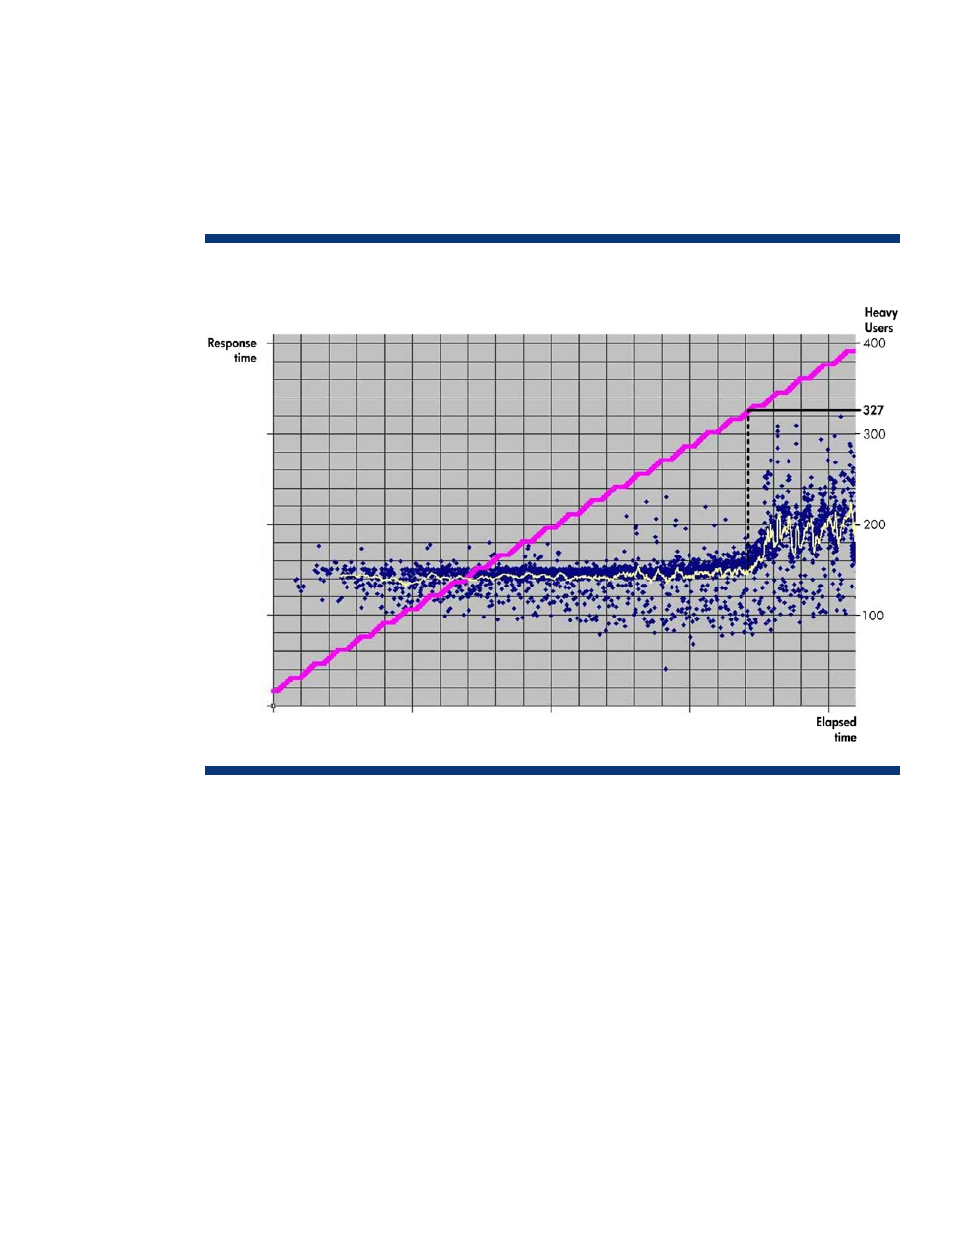
Figure 4 shows sample results for the HP ProLiant DL585 G5 server running a typical canary script.
Individual user response times are shown in blue, with a yellow line depicting average response
times.
HP analyzed this figure to determine when response times began to increase markedly and
consistently over a baseline level, indicating that user response times had become unacceptable.
Figure 4. Canary time values show that response times began to become unacceptable when 327 Heavy Users were active
Figure 4 indicates that the HP ProLiant DL585 G5 server could support 327 Heavy Users before
response times started to increase markedly, validating the optimal value of 288 Heavy Users
derived using % Processor Time values.
13
See also other documents in the category HP Computers:
- UX B6941-90001 (548 pages)
- A3661B (95 pages)
- C100/110 (252 pages)
- L1702 (45 pages)
- 576X-B (1 page)
- rx5670 (13 pages)
- ProLiant PC2-6400 (38 pages)
- PC (120 pages)
- S3240 (2 pages)
- LC 2000R (194 pages)
- GS80 (41 pages)
- COMPAQ DX2710 MT (107 pages)
- TOUCHSMART 9100 (62 pages)
- BC1500 (13 pages)
- Proliant DL580 (48 pages)
- Proliant DL580 (53 pages)
- DX2200 (31 pages)
- ProLiant Server Blade BL460c (31 pages)
- P6000 (105 pages)
- d530 Series (2 pages)
- dc5700 (216 pages)
- RX7620-16 (43 pages)
- ProLiant ML370 G5 (46 pages)
- PROLIANT ML350 G6 (54 pages)
- BL35P (22 pages)
- COMPAQ DC5750 (214 pages)
- Agent-Desktop-Laptop Computer (23 pages)
- DL380 G7 (126 pages)
- xw8600 (73 pages)
- Pavilion A6140 (2 pages)
- Z800 (55 pages)
- 8080 ELITE BUSINESS (284 pages)
- VECTRA VL800 (72 pages)
- Vectra XE320 (82 pages)
- Vectra XE320 (32 pages)
- AA-RTDRB-TE (146 pages)
- BL465C (66 pages)
- DM4 (113 pages)
- PROLIANT 580554-001 (87 pages)
- ProLiant ML330 (44 pages)
- ProLiant ML330 (34 pages)
- PROLIANT BL465C G7 (30 pages)
- LH 3r (23 pages)
- Compaq dc7900 (3 pages)
- T5000 (41 pages)