Counting report – ACTi IVS Server 1 V2.02.06 User Manual
Page 48
ACT
i IVS Server 1 User’s Manual
Counting Report
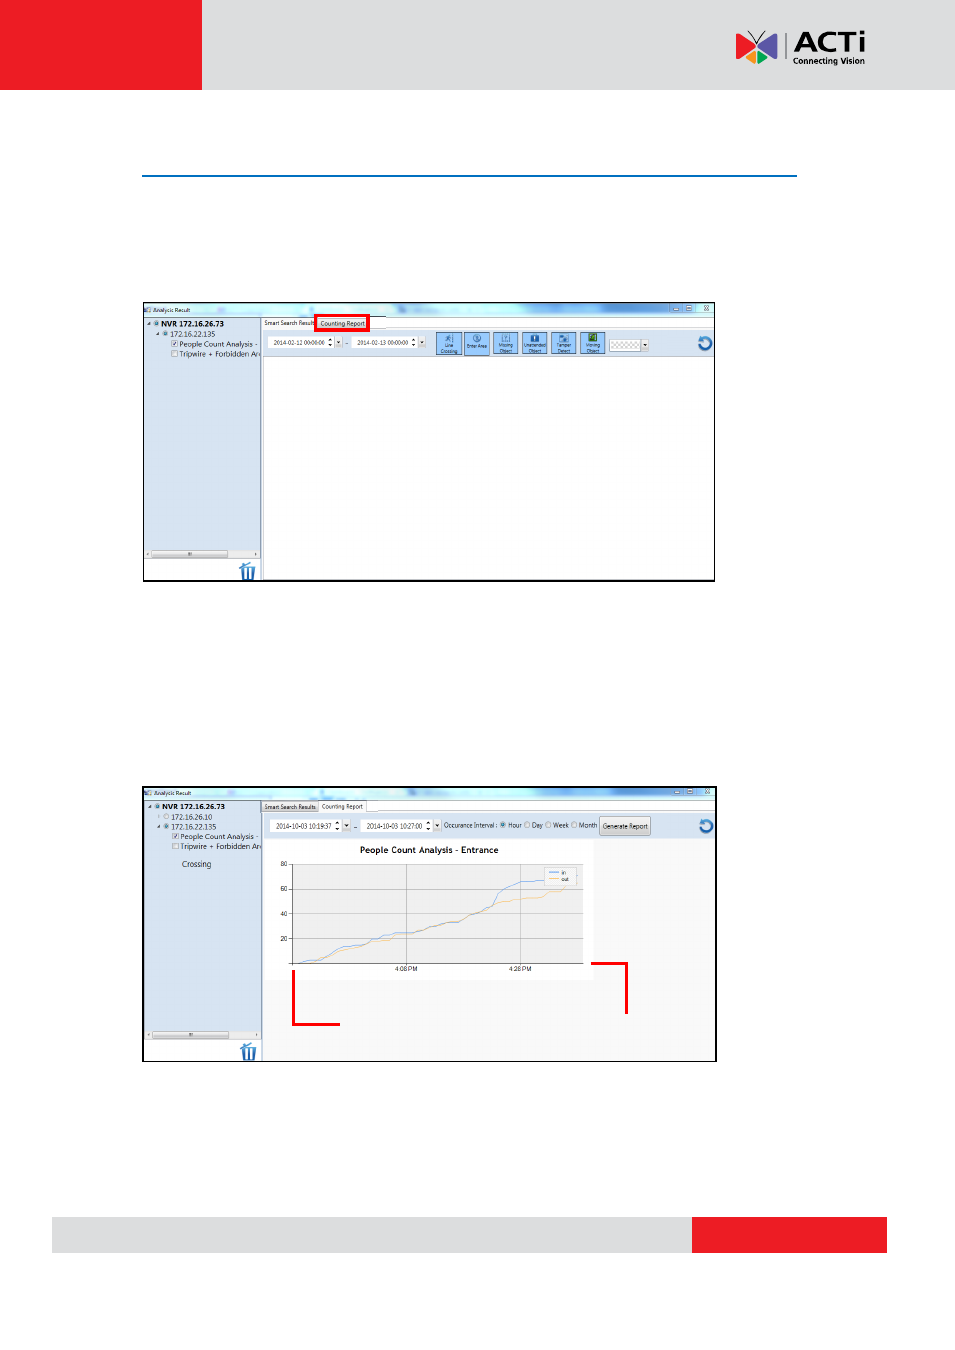
If your analysis rule uses a
counting
algorithm, you can gain more insights using the
Counting Report
. To access this report, you can select the
“Counting Report”
tab at the top
of your
Analysis Result
window.
Your
Counting Report
will appear, showing a graph with the number of people or objects that
have entered or exited a certain area based on the previously drawn reference line. Note that
the title of the graph is the name of the analysis rule previously created. The x and y-axis are
for time passed and number of people or object, respectively. The value for people/object that
have entered the area is shown in blue, while the value for people/object that have exited the
area is shown in yellow.
1
Time Passed
Number of People/Object