Overview of each testing table – Xtramus NuApps-QoS-RM V1.1 User Manual
Page 48
48
E-mail: [email protected]
Website: www.Xtramus.com
XTRAMUS TECHNOLOGIES
®
Overview of each testing table
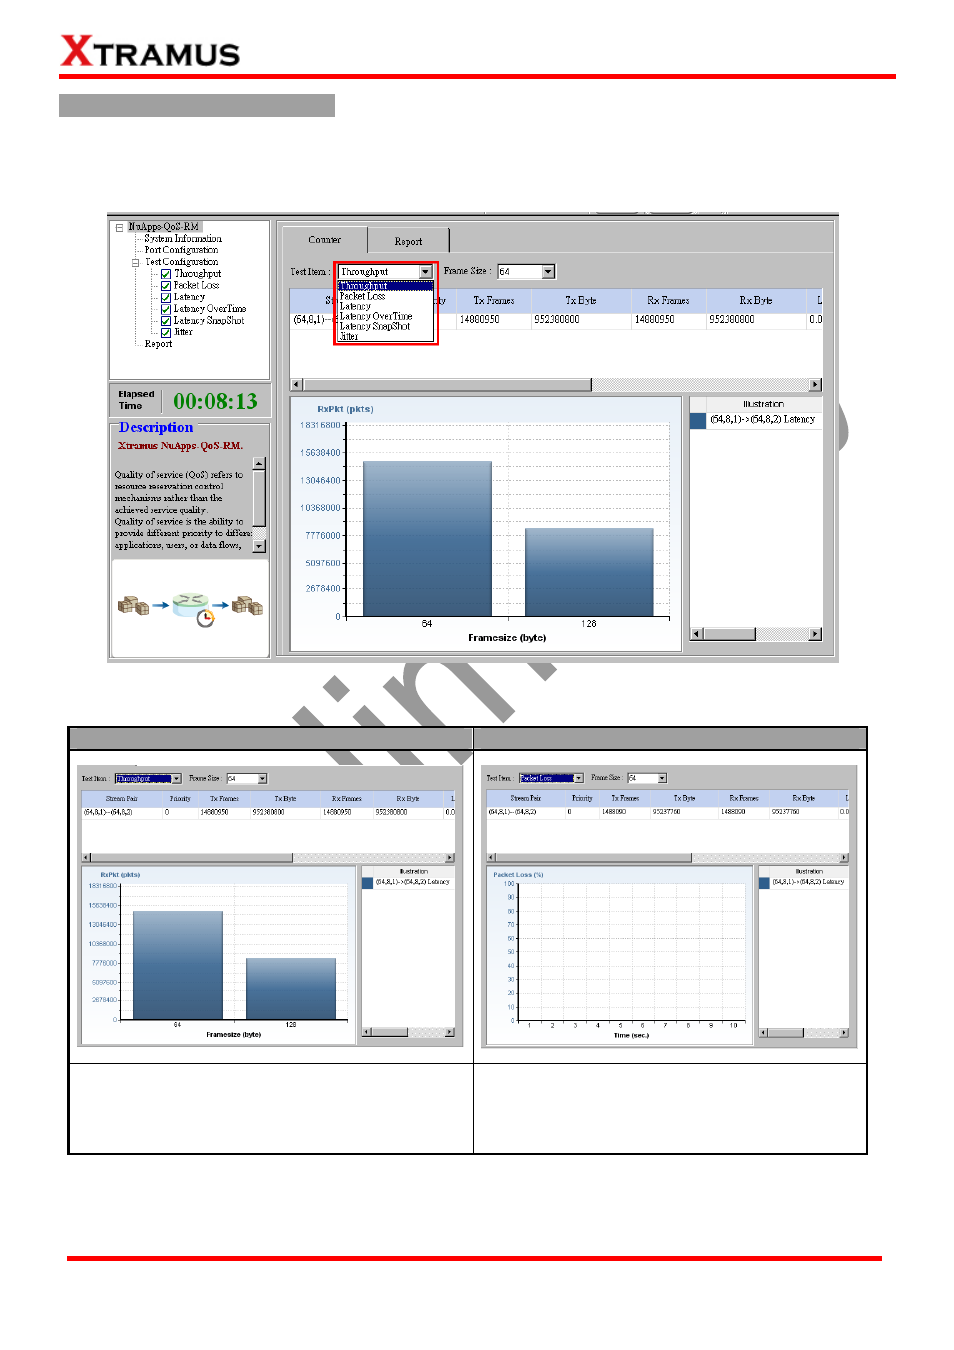
Choose the testing table that you want to evaluate by choosing from the scroll on the Counter option
shown on the figure below down:
Throughput Test Report
Packet Loss
This chart uses Frame Count per Second as
X-axis, and Frame Size as Y-axis to show DUT’s
throughput performance.
This chart uses Packet Loss Rate (%) as
X-axis, and Frame Size/Load as Y-axis to show
DUT’s packet loss ratio.