Casella CEL Airborne particulate monitoring system User Manual
Page 30
HB3256-03
Page 28
A file selection window will appear from which the relevant data file should be selected. Ensure
the correct data file corresponding to the filter result is chosen. If the file has already been
corrected for gravimetric results then a warning message will be given.
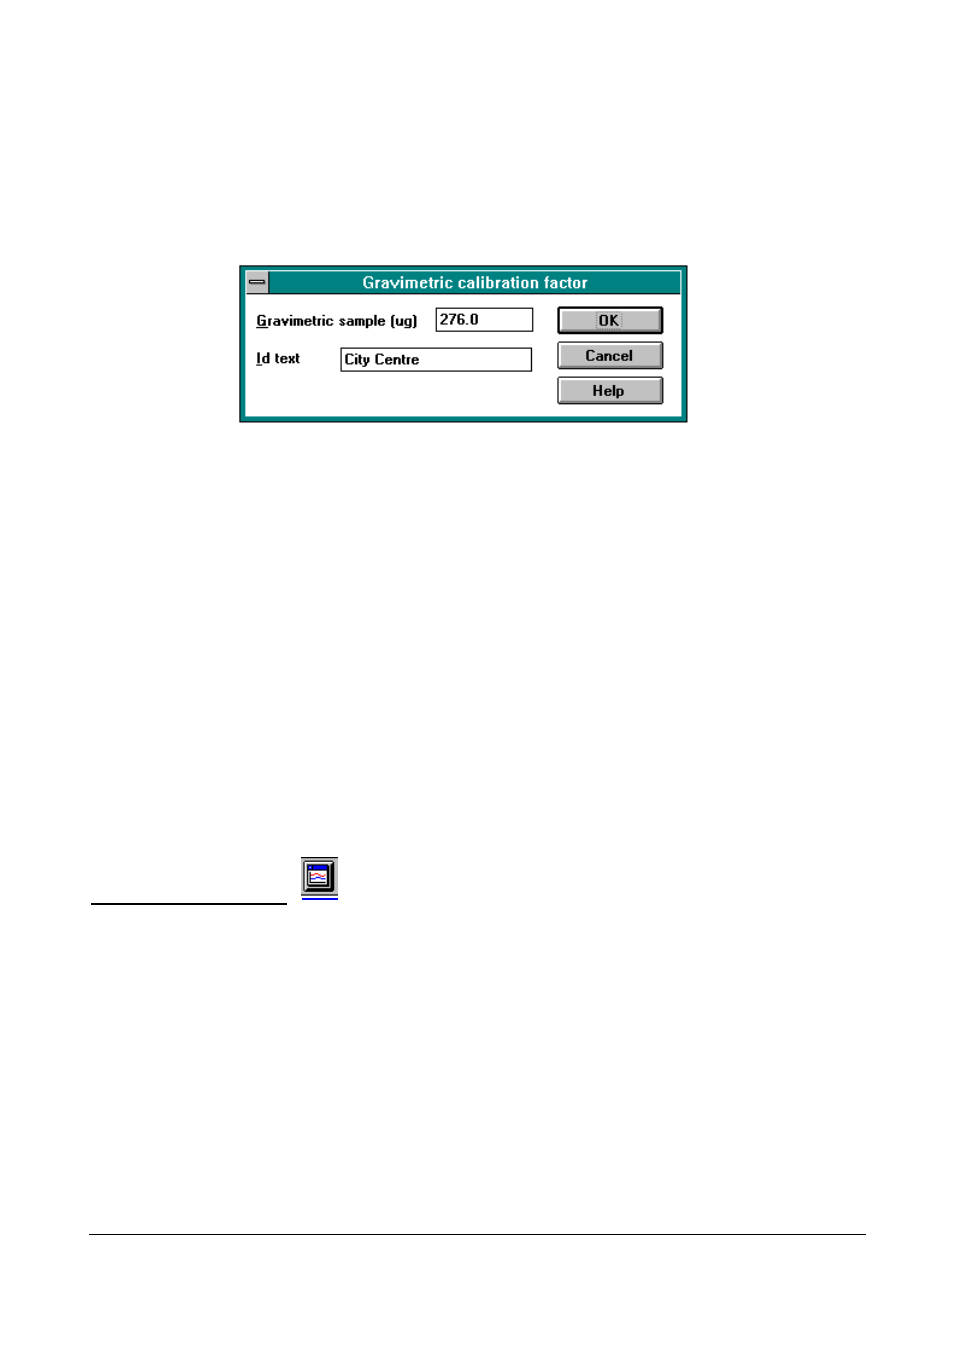
After accepting the data file the following window will be displayed.
Enter the filters mass increase in
µgrams and, if desired, an identification comment. Select O.K
to complete. A ‘Confirmation To Proceed’ window will be displayed.
The software will calculate the gravimetric dust density based upon the input sample mass and
‘Volume Sampled’ value contained within the data file. The gravimetric result is ratiometrically
compared to the ‘Total PM10 Average’ value within the data file. A correction factor will be
calculated and applied to all dust density values within the file.
Example;
Input sample mass
1168
µg
Volume sampled in file
45.3
m
3
Gravimetric Result
25.78
µg/
m
3
Original PM10 Total Average 23.87
µg/
m
3
(in data file)
Calculated Correction Factor
1.080
(All dust values in file will be scaled by this factor)
New PM10 Total Within File
25.78
µg/
m
3
Graphical Presentation.
The
'
Show Graph
'
option from the
'
Report
'
menu or the control button shown above may be
used to present data files in a graphical format.
A file selection window will appear from which the relevant data file should be selected.
A graph will be displayed spanning the entire period within the data file.