Typical calibration curve 2% model – Viconics VH20 User Manual
Page 3
3
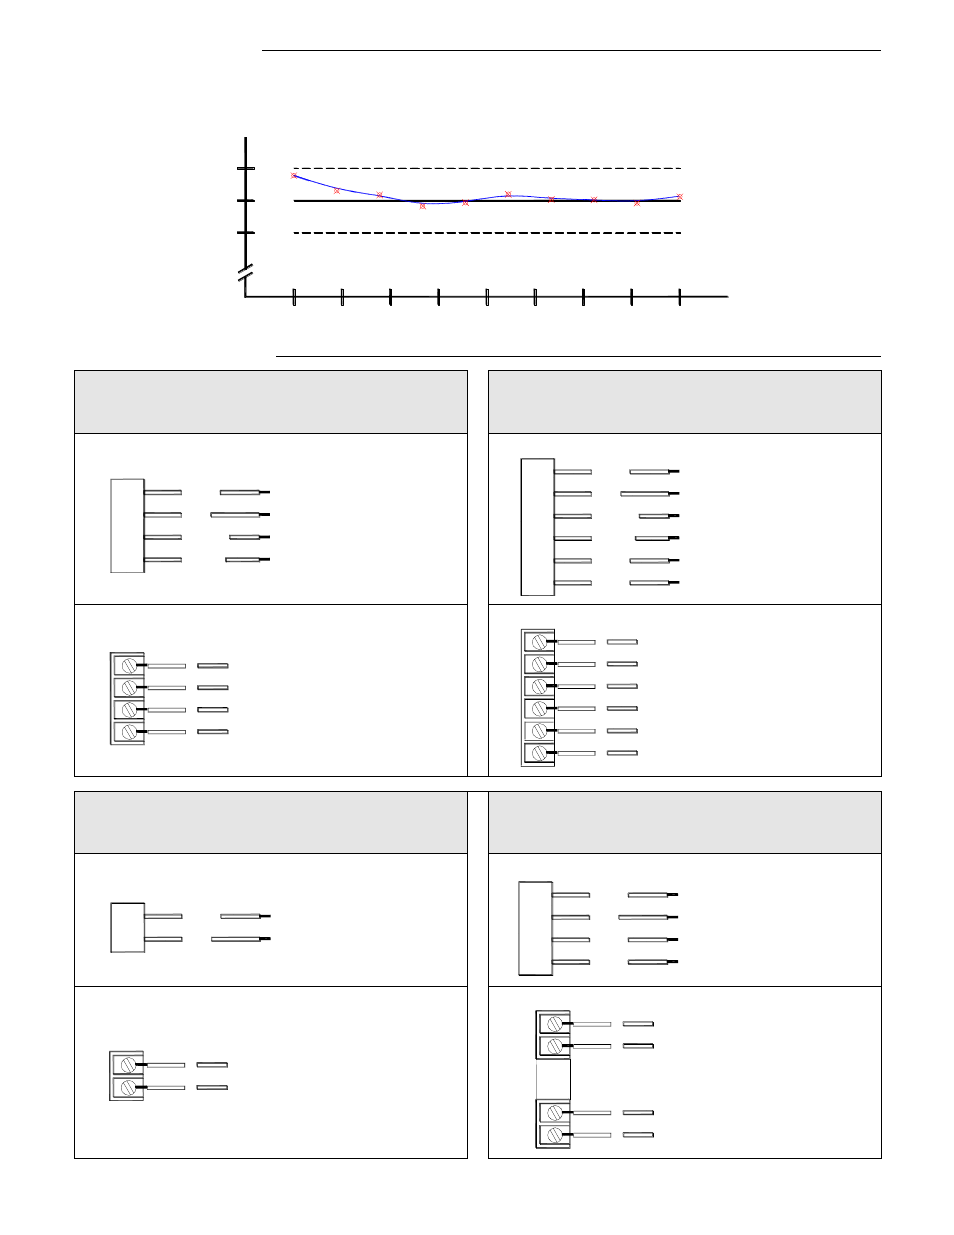
Typical calibration curve
The VH20 2% series, microcomputer-based humidity transmitters are calibrated with a 10 point curve with each point
equally spread from 10% to 90%
Wiring of VH20 transmitter
0 to 10 Vdc / 0 to 5 Vdc output models
4 wires / terminals
0 to 10 Vdc / 0 to 5 Vdc output models
With optional temperature sensor
6 wires / terminals
4 to 20 mA output models
2 wires / terminals
4 to 20 mA output models
With optional temperature sensor
4 wires / terminals
-2% R.H.
+2% R.H.
Reference
10
20
60
40
30
50
70
80
90
Typical Calibration Curve 2% Model
% R.H.
Vdc Power (+) 12-30 Vdc
4 to 20 mA Output
VH20 Duct model
Red
Black
VH20 Wall and Outdoor models
2
1
Vdc Power (+) 12-30 Vdc
4 to 20 mA Output
2
1
VH20 Wall and Outdoor models
5
6
1
2
Temperature sensor
Temperature sensor
4 to 20 mA Output
Vdc Power (+) 12-30 Vdc
6
5
1
2
4 to 20 mA Output
Temperature sensor
Temperature sensor
Vdc Power (+) 12-30 Vdc
White
VH20 Duct model
Black
White
Red
VH20 Wall and Outdoor models
6
5
4
3
2
1
Temperature sensor
Temperature sensor
6
5
0 to 10 Vdc Output
0 to 5 Vdc Output
Power (+) 12-30 Vdc / 24 Vac
Common (-)
2
4
3
1
VH20 Wall and Outdoor models
1
3
4
2
0 to 10 Vdc Output
0 to 5 Vdc Output
Power (+) 12-30 Vdc / 24 Vac
1
Common (-)
3
4
2
Power (+) 12-30 Vdc / 24 Vac
0 to 10 Vdc Output
0 to 5 Vdc Output
Orange
Black
Yellow
Red
VH20 Duct model
Common (-)
Temperature sensor
Temperature sensor
White
White
0 to 5 Vdc Output
Power (+) 12-30 Vdc / 24 Vac
0 to 10 Vdc Output
Orange
VH20 Duct model
Red
Yellow
Black
Common (-)