ALTANA Smart-Chart User Manual
Page 6
1. Overview
Numerous production parameters influence color and appearance. Representative quality
control requires structured analysis. The smart-chart software allows for systematic
planning and efficient handling of the series. Depending on the application, the system can
be used in various ways, from single measurements in R&D up to routine process control
procedures.
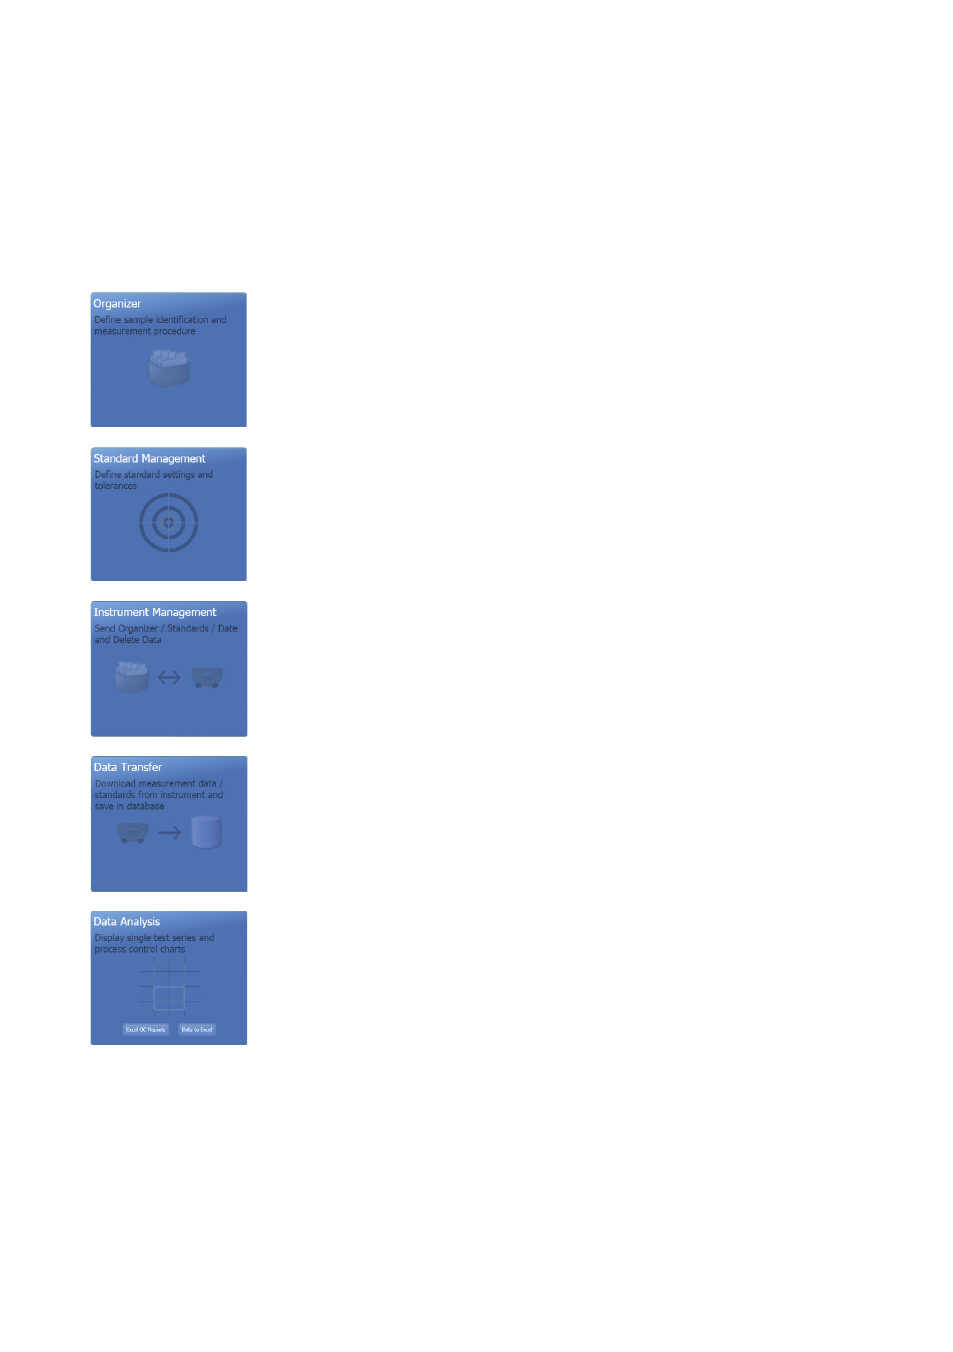
The smart-chart software allows to create so-called Organizer
files which define the object to be measured and the sampling
procedure. Thus, every user always measures the same way.
Clear object identification without notepad: just select model,
color and paint line, then start measuring.
The Standard Management tool defines standards and their
tolerances for Pass/Fail indication with “Traffic Lights”.
Standards and Organizers are transfered to the instrument
to guide the user during measurement.
The measurement results are automatically saved in the
instrument and can now be downloaded for saving in
an SQL-database.
The Data Analysis tool allows to select the desired single test
series and displays its measurement results in a data table
and in a graphical silhouette of the object including
Pass/Fail indication with “Traffic Lights”.
Direct Help features are included in the smart-chart software. This manual describes the
advanced analysis which is performed using the functionality of Excel.