ALTANA Smart-Chart User Manual
Page 20
Trend by Angle
Color and effect data are displayed on one report. The data is grouped by angle. Thus, the
uniformity per angle can be easily analyzed.
Lab 3 illuminants
In this chart color data for 3 illuminants are displayed simultaneously per measurement
angle. The desired illuminants can be picked by use of the drop-down list. In the graphs
specific symbols are used for the different illuminants. The table below shows the
numerical results.
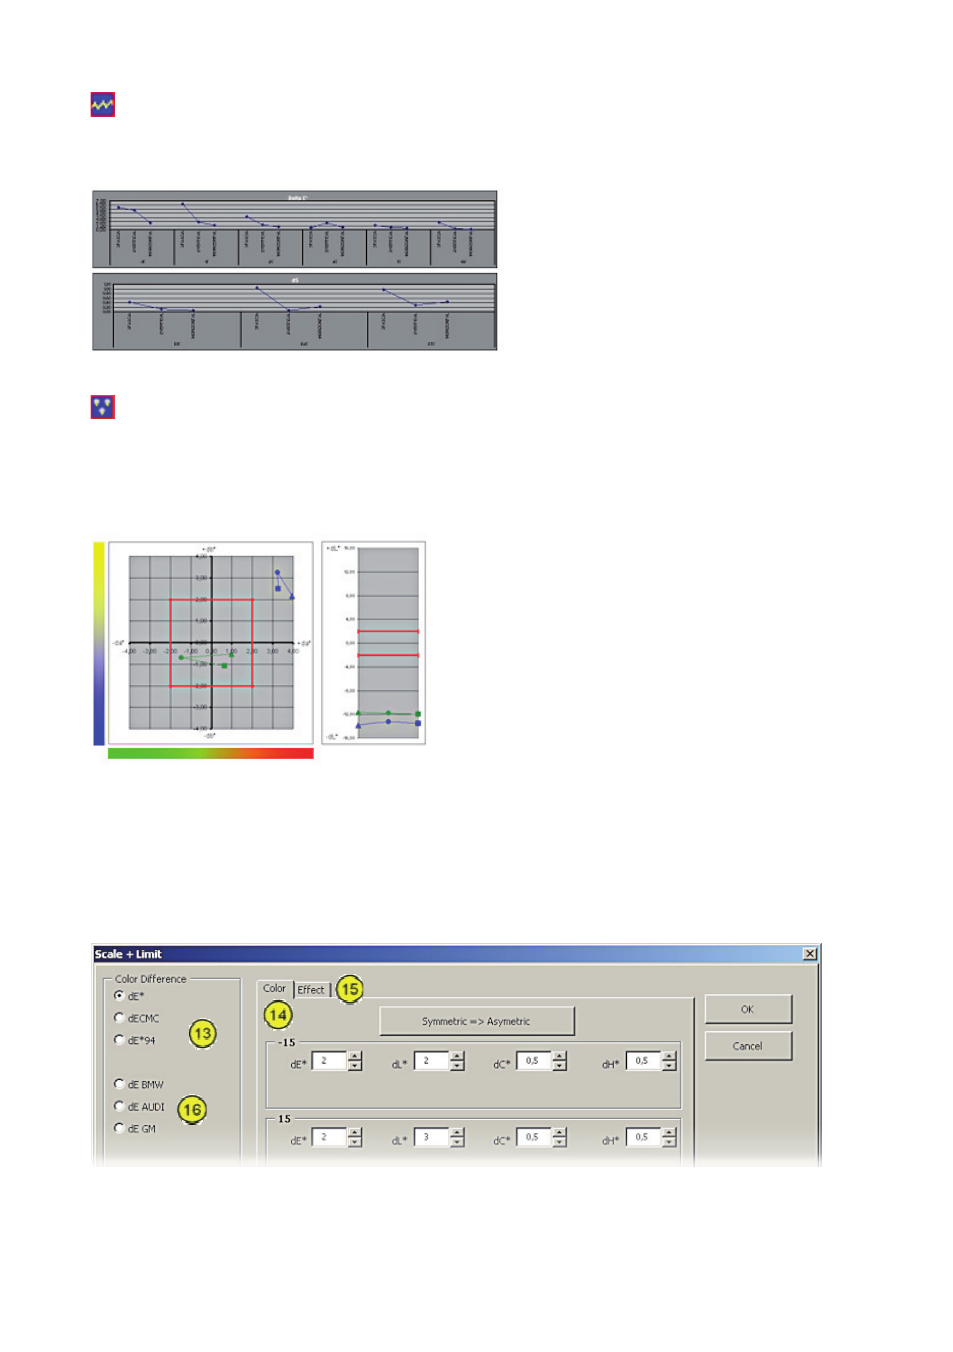
Scale + Limit
This button of the toolbar opens a dialog box to select the Color Difference Method and
Color System (13). The tolerances can be defined for every angle (14), using Symmetric or
Asymmetric tolerances. The scales for effect evaluation and its respective tolerances can
be set under the "Effect" tab (15).