ALTANA Smart-Chart User Manual
Page 11
3. Analyze Data using QC Reports
Preprepared test reports for BYK-mac and wave-scan assist in analyzing the data of
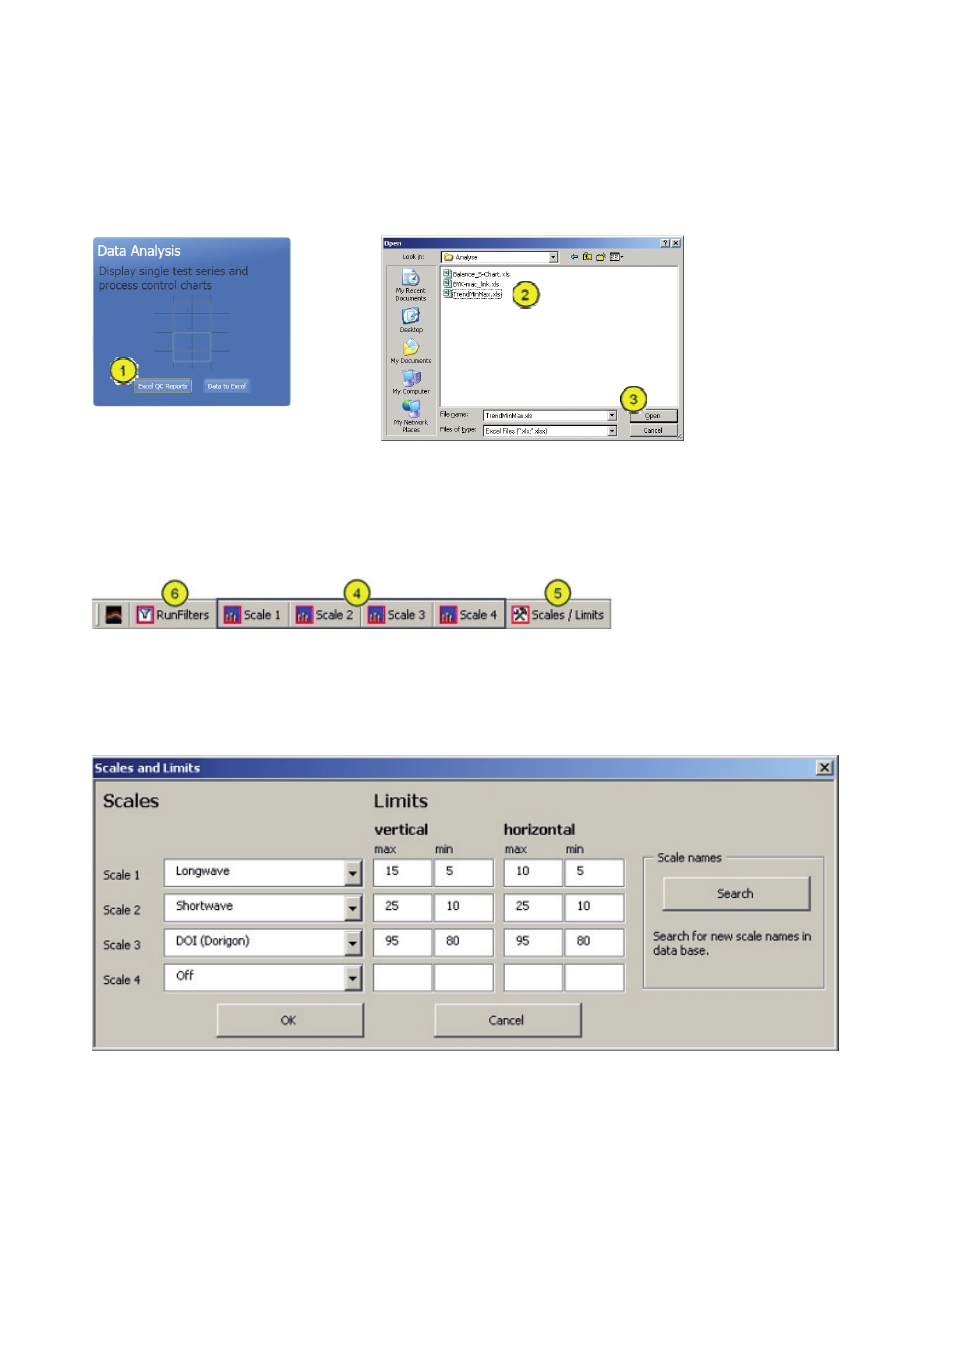
multiple test series. Press the button "Excel QC Reports" (1) to find the list of the various
Excel workbooks:
Select the desired report by double click (2) or highlight and press "Open" (3).
Every workbook includes a toolbar which allows to switch between several pages with
different graphs (4):
The scales to be displayed can be selected (5) and limits according to your specifications
can be entered for horizontal and vertical checkzones.
Example: Trend MinMax for the wave-scan family:
The button "Run Filters" (6) of the toolbar opens a window which allows to define and
change between several filters for routine reporting. Examples are shown in the following
descriptions of the reports.