Casio fx-991ES PLUS User Manual
Page 25
E-24
• See the table at the beginning of this section of the manual for the regression
formulas.
•
K
,
K
1
,
K
2
and
L
are not variables. They are commands of the type that take
an argument immediately before them. See “Calculating Estimated Values”
for more information.
Minimum Value: minX*, minY, Maximum Value: maxX*, maxY
(STAT) (MinMax) to
Note: While single-variable statistical calculation is selected, you can input
the functions and commands for performing normal distribution calculation
from the menu that appears when you perform the following key operation:
(STAT) (Distr). See “Performing Normal Distribution Calculations”
for details.
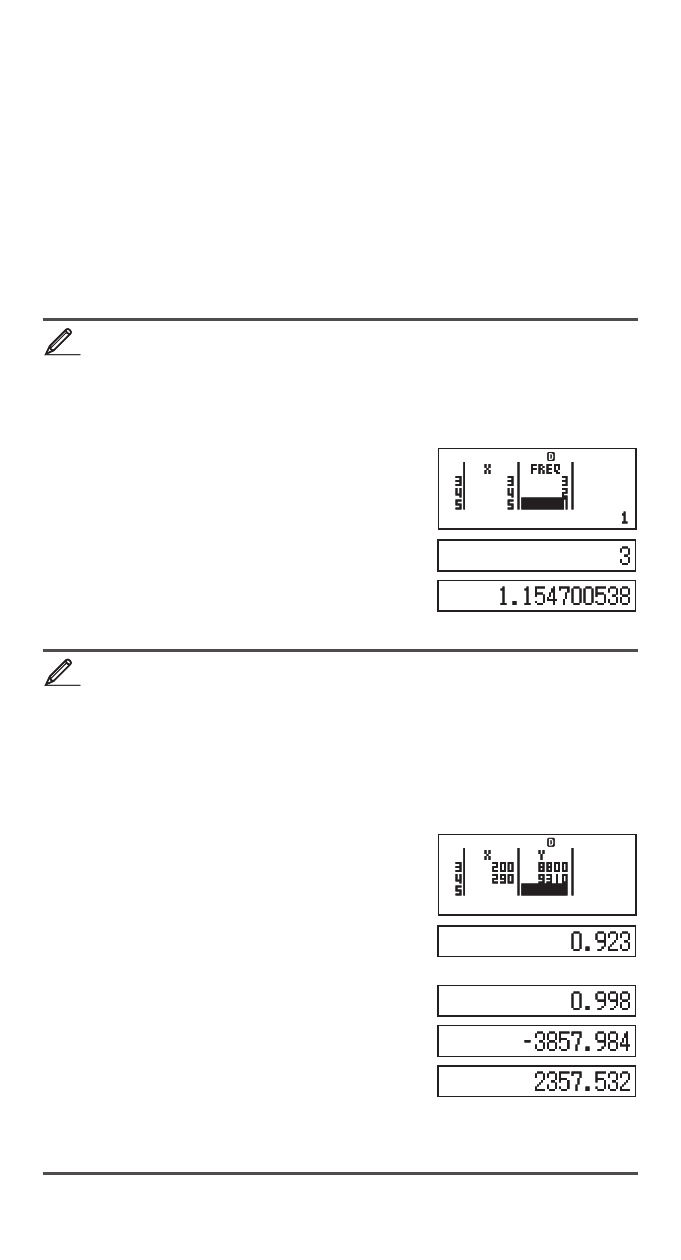
To input the single-variable data
x
= {1, 2, 2, 3, 3, 3, 4, 4, 5}, using
the FREQ column to specify the number of repeats for each items
({
x
n
; freq
n
} = {1;1, 2;2, 3;3, 4;2, 5;1}), and calculate the mean and
population standard deviation.
(SETUP)A(STAT)(ON)
(STAT)(1-VAR)
1
2 3 4 5 AC
1
2 3 2
(STAT)(Var)(M)
(STAT)(Var)(
x
S
n
)
Results: Mean: 3 Population Standard Deviation: 1.154700538
To calculate the linear regression and logarithmic regression
correlation coefficients for the following paired-variable data and
determine the regression formula for the strongest correlation: (
x
,
y
)
= (20, 3150), (110, 7310), (200, 8800), (290, 9310). Specify Fix 3
(three decimal places) for results.
(SETUP)A(STAT)(OFF)
(SETUP)(Fix)
(STAT)(A+BX)
20
110 200 290 AC
3150
7310 8800 9310
(STAT)(Reg)(r)
(STAT)(Type)(In X)
(STAT)(Reg)(r)
(STAT)(Reg)(A)
(STAT)(Reg)(B)
Results: Linear Regression Correlation Coefficient: 0.923
Logarithmic Regression Correlation Coefficient: 0.998
Logarithmic Regression Formula:
y
= –3857.984 + 2357.532ln
x
2
2
STAT
STAT
3
3
STAT
FIX
STAT
FIX