ChemoMetec SCC-100 User Manual
Page 34
5 Operation of the NucleoCounter
22
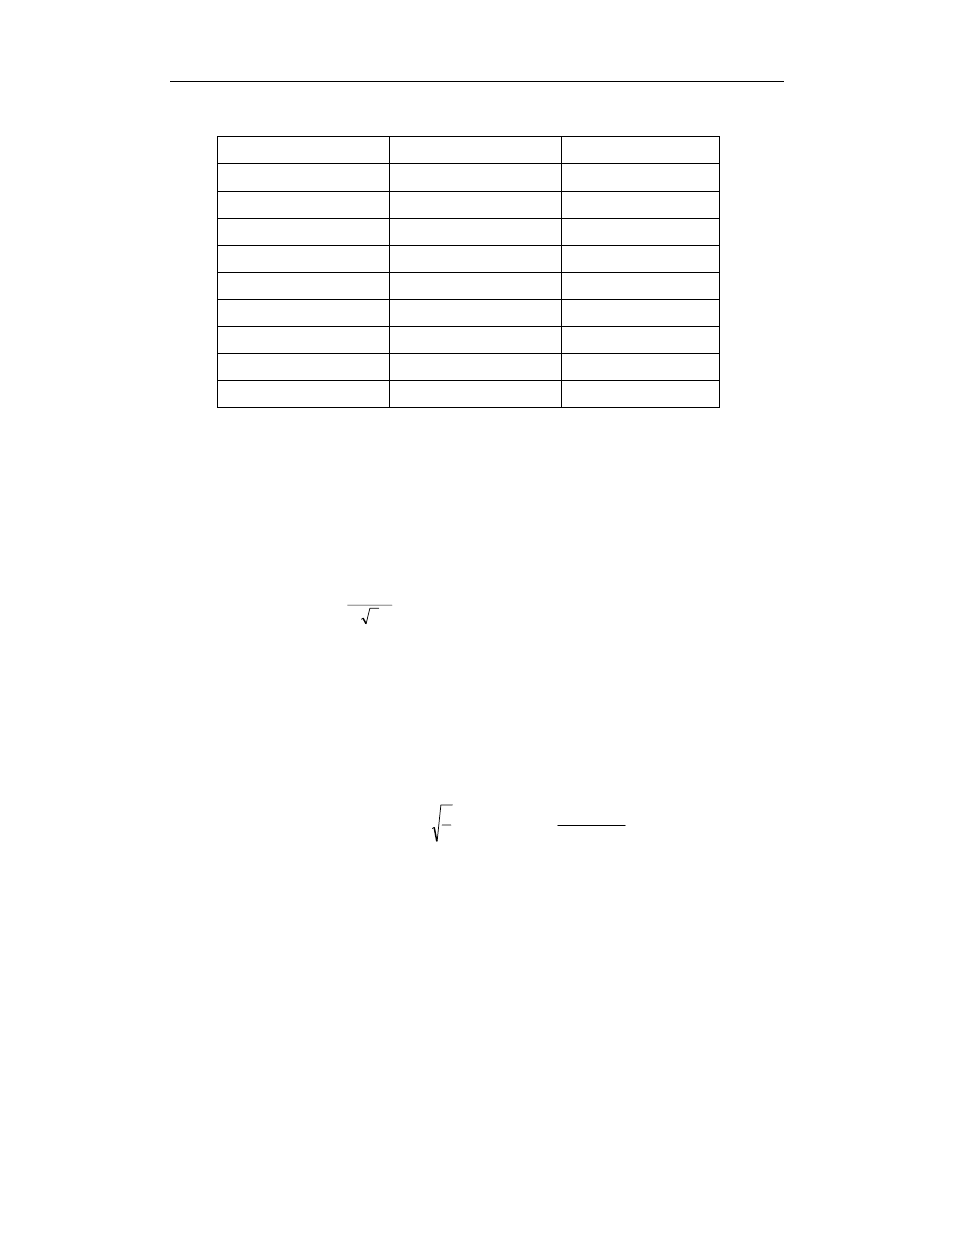
Table 4 List of SCC and the corresponding s
Poisson
SCC S
Poisson
(SCC) '000
S
Poisson
(%)
50,000 7 14.
100,000 10
10.
200,000 14
7.1
400,000 20
5.0
600,000 25
4.1
800,000 28
3.5
1,000,000 32
3.2
1,500,000 39
2.6
2,000,000 45
2.2
The table above gives an indication of the number of significant digits in the reported
results, when expressed as one standard deviation of repeatability. Please note that if
the result is based on the average of 2 or more measurements then the expected
standard deviation of the mean result is the corresponding standard deviation at that
level divided by the square root of measurements. As an example, if the average of 4
measurements of the same sample results in SCC of 400,000 cells/ml then the standard
deviation of the mean is
4
000
,
20
equal to 10,000 or 2.5%. Referring to the Poisson
distribution this corresponds to the counting of
600
,
1
400
4
=
⋅
events and this illustrates
that the precision of any SCC result is dependent on the total number of somatic cells
counted.
The Poisson distribution can therefore be used to determine the number of
measurements needed in order to obtain a result with a given precision, expressed as
one standard deviation, when the approximate cell count is known. According to the
Poisson distribution the number of counted cells, n, and the accuracy expressed as %
follow the equation: Accuracy%=
n
1
100 ⋅
and thus
2
100
Accuracy%
n
−
=
. If for instance a
result with the precision, e.g. standard deviation, of 2% is sought it is necessary to
count at least 2,500 cells, corresponding to at least; 25 measurements at SCC 100,000, 7
measurements at SCC 400,000, 3 measurements at SCC 1,000,000 and 2 measurements
at SCC 1,500,000.
5.5 Instrument
settings
The user can change several settings of the instrument, such as the date and time of the
built in clock and contrast of the instrument display.