Performance per dollar, Figure 7: blade solution performance per dollar, Blade solution performance per dollar – Dell POWEREDGE M915 User Manual
Page 17: Higher is better)
Power Efficiency Comparison of the Dell PowerEdge M915 and HP ProLiant BL680c G7 Blade Solutions
17
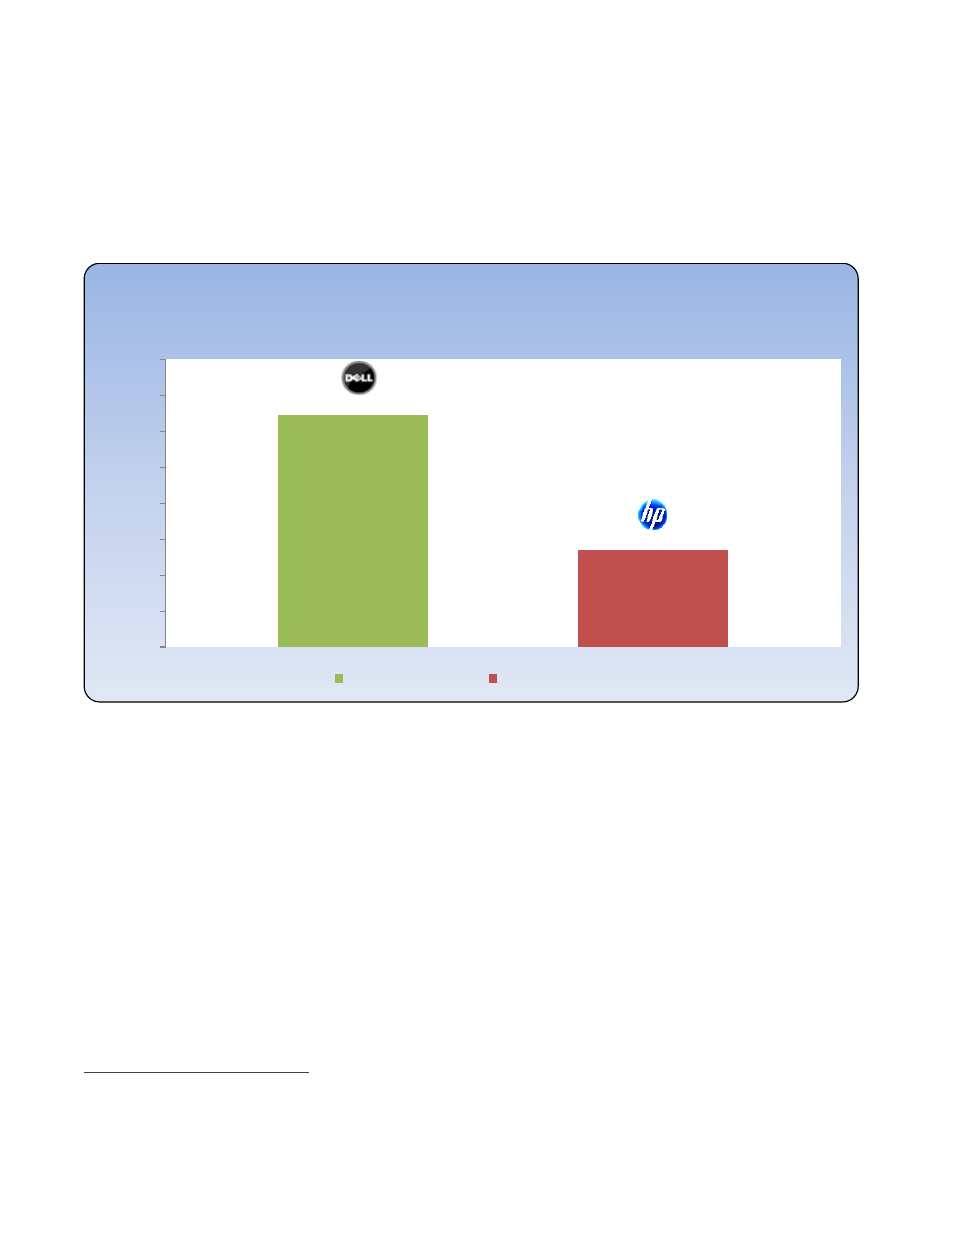
Performance per Dollar
The lower price and higher overall performance of the Dell solution allow it to provide 129 ssj_ops at 100%
target load for each U.S. dollar spent on the solution, compared to just 54 ssj_ops at 100% target load
12
for
each dollar spent on the HP solution, as seen in Figure 7.
Figure 7: Blade Solution Performance per Dollar
12
The 8-node M915 achieved 14,982,232 ssj_ops@100% target load and a SPECpower_ssj2008 result of 2,425 overall ssj_ops/Watt,
compared to the 4-node BL680c G7 with 7,996,829 ssj_ops@100% target load and a SPECpower_ssj2008 result of 1,260 overall
ssj_ops/Watt.
129
54
0
20
40
60
80
100
120
140
160
ssj
_o
p
s
@
100%
su
b
m
e
asu
re
m
e
n
t
/
U.S
.
d
o
llar
Blade Solution Performance per Dollar
(higher is better)
Dell Blade Solution
HP Blade Solution
- AXIM X3 (158 pages)
- AXIM X3 (366 pages)
- AXIM X3 (178 pages)
- AXIM X3 (2 pages)
- PowerVault MD3220 (32 pages)
- PowerVault MD3220 (2 pages)
- PowerVault MD3220 (74 pages)
- PowerVault MD3220 (28 pages)
- PowerVault MD3220 (32 pages)
- PowerVault MD3220 (32 pages)
- PowerVault MD3220 (237 pages)
- PowerVault MD3220 (32 pages)
- PowerVault MD3220 (32 pages)
- PowerVault MD3220 (388 pages)
- PowerVault MD3220 (32 pages)
- PowerVault MD3220 (6 pages)
- PowerVault MD3220 (174 pages)
- PowerVault MD3220 (32 pages)
- PowerVault MD3220 (76 pages)
- PowerVault MD3220 (11 pages)
- PowerVault MD3220 (76 pages)
- PowerVault MD3220 (272 pages)
- PowerVault 114x (7 pages)
- PowerVault 114x (49 pages)
- PowerVault MD3200i (34 pages)
- POWERVAULT MD3600F (17 pages)
- PowerVault MD3200i (32 pages)
- POWERVAULT MD3600F (90 pages)
- POWERVAULT MD3620F (16 pages)
- POWERVAULT MD3600F (38 pages)
- POWERVAULT MD3600F (318 pages)
- PowerVault MD3200i (32 pages)
- PowerVault MD3200i (75 pages)
- PowerVault MD3200i (32 pages)
- PowerVault MD3200i (32 pages)
- POWERVAULT MD3600F (90 pages)
- PowerVault MD3200i (21 pages)
- PowerVault MD3200i (32 pages)
- PowerVault MD3200i (32 pages)
- POWERVAULT MD3600F (2 pages)
- POWERVAULT MD3600F (222 pages)
- PowerVault MD3200i (22 pages)
- PowerVault MD3200i (32 pages)
- POWERVAULT MD3600F (2 pages)
- POWERVAULT MD3600F (222 pages)