Figure 3: blade solution full-chassis performance, Blade solution full-chassis performance – Dell POWEREDGE M915 User Manual
Page 12
Power Efficiency Comparison of the Dell PowerEdge M915 and HP ProLiant BL680c G7 Blade Solutions
12
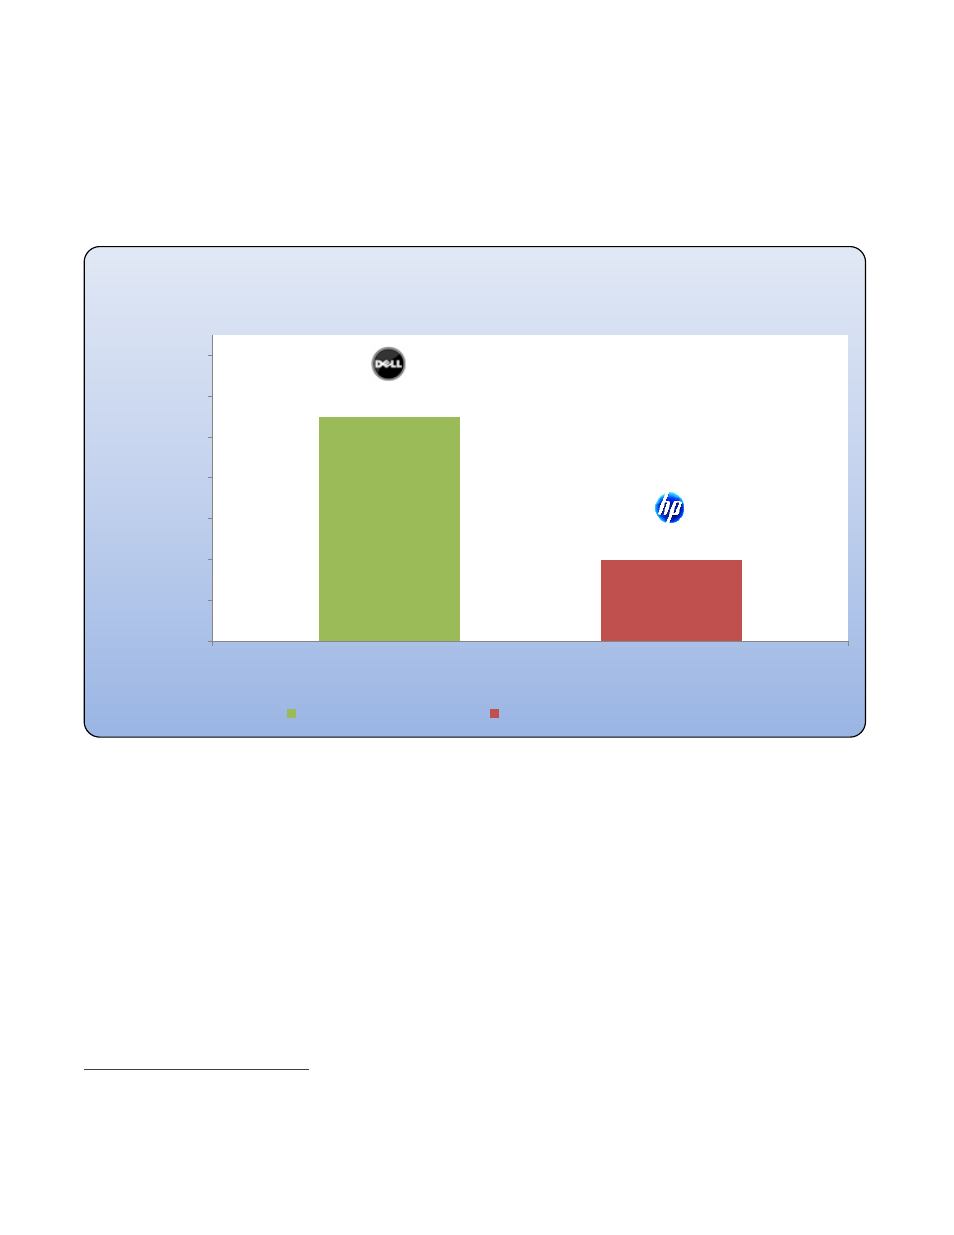
The PowerEdge M915 blade solution’s density advantage is illustrated in Figure 3. While both solutions
consume 10U of rack space, the Dell solution can accommodate 8 M915 blades compared to only 4 BL680c G7
blades in the HP solution. This leads to the Dell solution’s 87% advantage in aggregate full-chassis
performance
5
.
Figure 3: Blade Solution Full-Chassis Performance
5
The 8-node M915 achieved 14,982,232 ssj_ops@100% target load and a SPECpower_ssj2008 result of 2,425 overall ssj_ops/Watt,
compared to the 4-node BL680c G7 with 7,996,829 ssj_ops@100% target load and a SPECpower_ssj2008 result of 1,260 overall
ssj_ops/Watt.
14,982,232
7,996,829
4,000,000
6,000,000
8,000,000
10,000,000
12,000,000
14,000,000
16,000,000
18,000,000
SPECpower_ssj2008
(ssj_ops @ 100% target load, higher is better)
ssj
_o
p
s
@
100%
su
b
m
e
asu
re
m
e
n
t
Blade Solution Full-Chassis Performance
(Higher is better)
8 x Dell PowerEdge M915
4 x HP ProLiant BL680c G7