Figure 4: power utilization at active idle – Dell POWEREDGE R720 User Manual
Page 9
Power Efficiency Comparison of the Dell PowerEdge R720 and HP ProLiant DL380p Gen8 Rack Servers
9
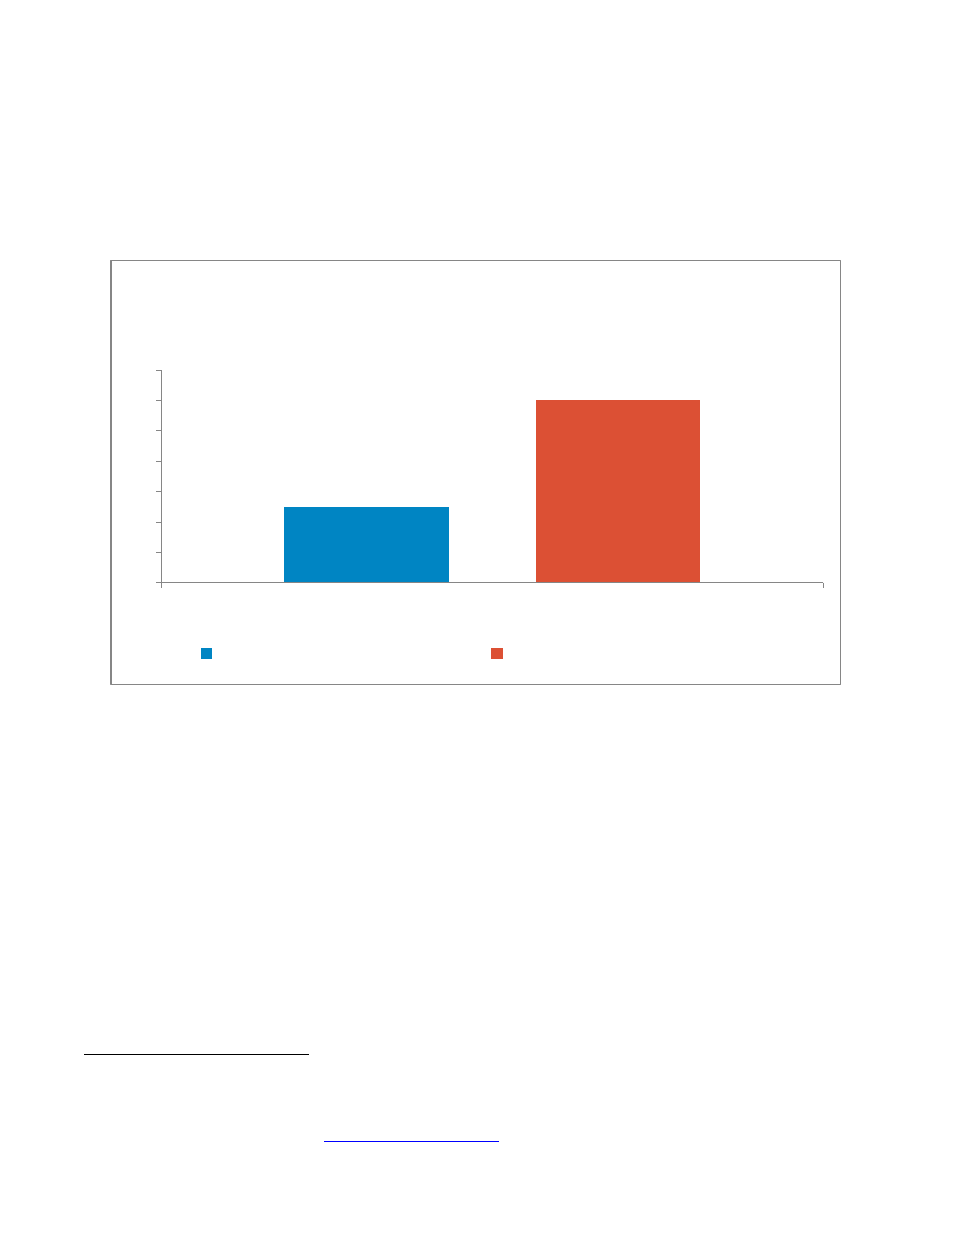
SPECpower_ssj2008 also includes a measurement of power while the servers are at 0% target utilization (Active
Idle). The ProLiant DL380p Gen8 drew 17.5W (10%) more than the PowerEdge R720 when both systems were
idle.
Figure 4: Power utilization at active idle
4
4
Required SPEC disclosure information: R720 scores: (1,235,223 ssj_ops and 303W) @ 100% target load and 3,352 overall ssj_ops/watt vs.
DL380p Gen8: (1,217,238 ssj_ops and 324W) @ 100% and 2,861 overall ssj_ops/watt. Comparison based on results by Dell Labs June 2012.
SPEC® and the benchmark name SPECpower_ssj® are registered trademarks of the Standard Performance Evaluation Corporation. For
more information about SPECpower, see
87.5
105
75
80
85
90
95
100
105
110
Power draw in watts
(lower is better)
SPECpower results
Power utilization at 0% target load (active idle)
in watts (lower is better)
Dell PowerEdge R720
HP ProLiant DL380p Gen8