Results – Dell POWEREDGE R720 User Manual
Page 6
Power Efficiency Comparison of the Dell PowerEdge R720 and HP ProLiant DL380p Gen8 Rack Servers
6
Results
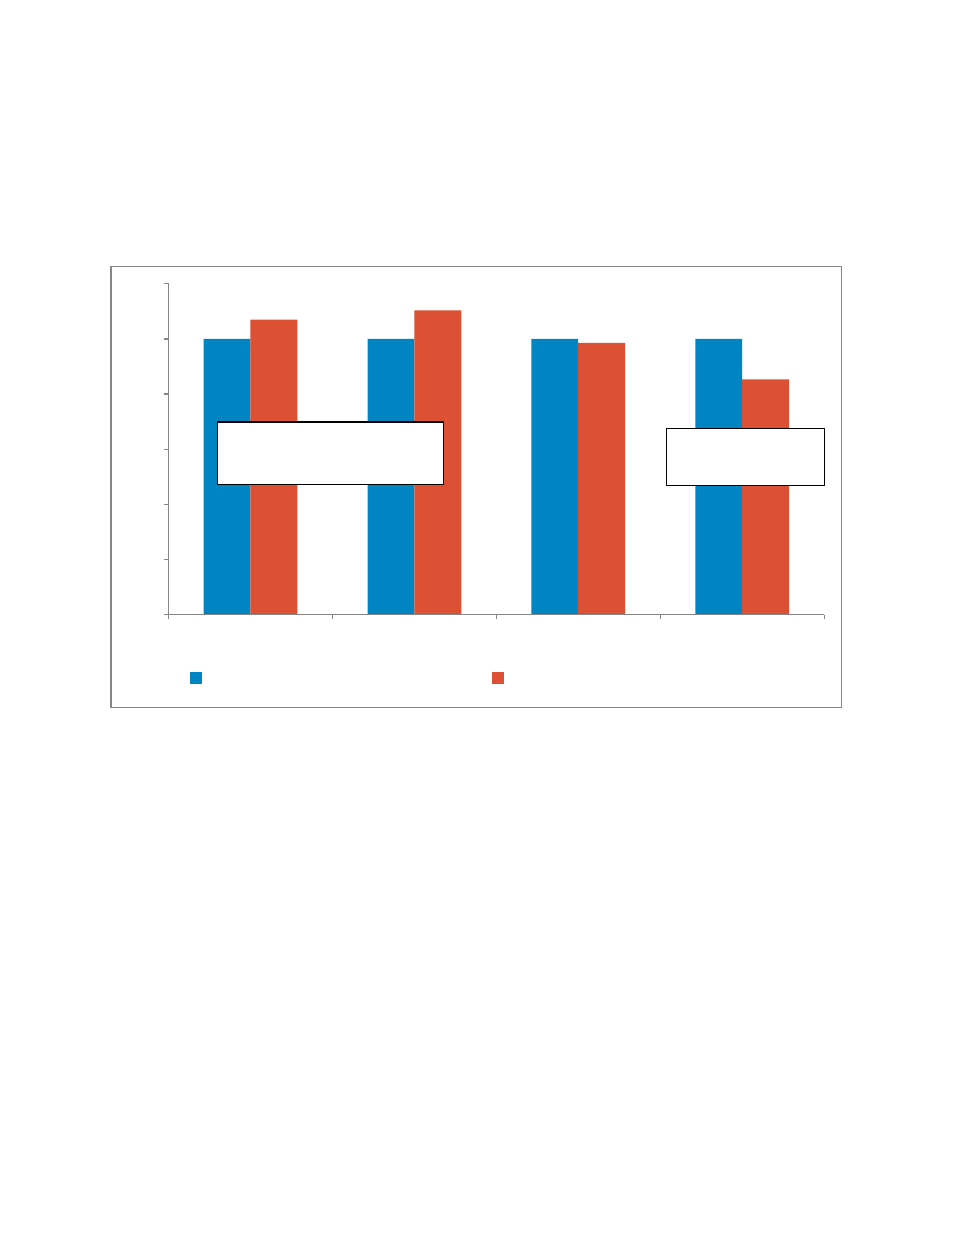
In this like-for-like comparison, the Dell PowerEdge R720 drew less power than the HP ProLiant DL380p Gen8 at
idle, at 100% target load, and at all points between, while maintaining a slight performance advantage at 100%
target workload. This lead to the 15% lower performance/watt ratio for the DL380p Gen8.
Figure 1: Normalized SPECpower_ssj2008 results for PowerEdge R720 and ProLiant DL380p Gen8
1.00
1.00
1.00
1.00
1.07
1.10
0.99
0.85
0.00
0.20
0.40
0.60
0.80
1.00
1.20
Maximum Power Draw
(lower is better)
Idle Power Draw
(lower is better)
Maximum Performance
(higher is better)
Performance / Watt ratio
(higher is better)
Dell PowerEdge R720
HP ProLiant DL380p Gen8
Performance/Watt
ratio of the DL380p
Gen8 is 15% worse
The DL380p Gen8 consumes
7% more power at 100% load
and 10% more power at idle
- Inspiron 530 (2 pages)
- OptiPlex 755 (45 pages)
- OptiPlex 755 (248 pages)
- OptiPlex 755 (622 pages)
- OptiPlex 755 (528 pages)
- OptiPlex 755 (82 pages)
- OptiPlex 760 (76 pages)
- OptiPlex 760 (203 pages)
- OptiPlex 745 (212 pages)
- OptiPlex 745 (360 pages)
- OptiPlex 745 (428 pages)
- OptiPlex 780 (10 pages)
- OptiPlex 780 (74 pages)
- OptiPlex 780 (80 pages)
- OptiPlex 780 (73 pages)
- OptiPlex 780 (40 pages)
- OptiPlex 780 (14 pages)
- OptiPlex 780 (89 pages)
- OptiPlex GX620 (221 pages)
- OptiPlex GX620 (294 pages)
- OptiPlex GX620 (338 pages)
- Inspiron 530 (226 pages)
- OptiPlex 960 (Late 2008) (16 pages)
- OptiPlex GX260 (100 pages)
- OptiPlex GX260 (235 pages)
- OptiPlex FX160 (Late 2008) (132 pages)
- OptiPlex FX160 (20 pages)
- OptiPlex FX160 (Late 2008) (20 pages)
- OptiPlex 210L (150 pages)
- OptiPlex 210L (130 pages)
- OptiPlex 210L (128 pages)
- OptiPlex 210L (300 pages)
- OptiPlex 210L (258 pages)
- OptiPlex 320 (132 pages)
- OptiPlex 320 (312 pages)
- OptiPlex 320 (266 pages)
- OptiPlex 320 (356 pages)
- OptiPlex 320 (44 pages)
- OptiPlex 320 (140 pages)
- OptiPlex GX240 (283 pages)
- OptiPlex GX240 (298 pages)
- OptiPlex GX240 (182 pages)
- OptiPlex GX240 (144 pages)
- OptiPlex GX240 (121 pages)
- OptiPlex GX240 (86 pages)