Figure 3: power utilization at 70% target load – Dell POWEREDGE R720 User Manual
Page 8
Power Efficiency Comparison of the Dell PowerEdge R720 and HP ProLiant DL380p Gen8 Rack Servers
8
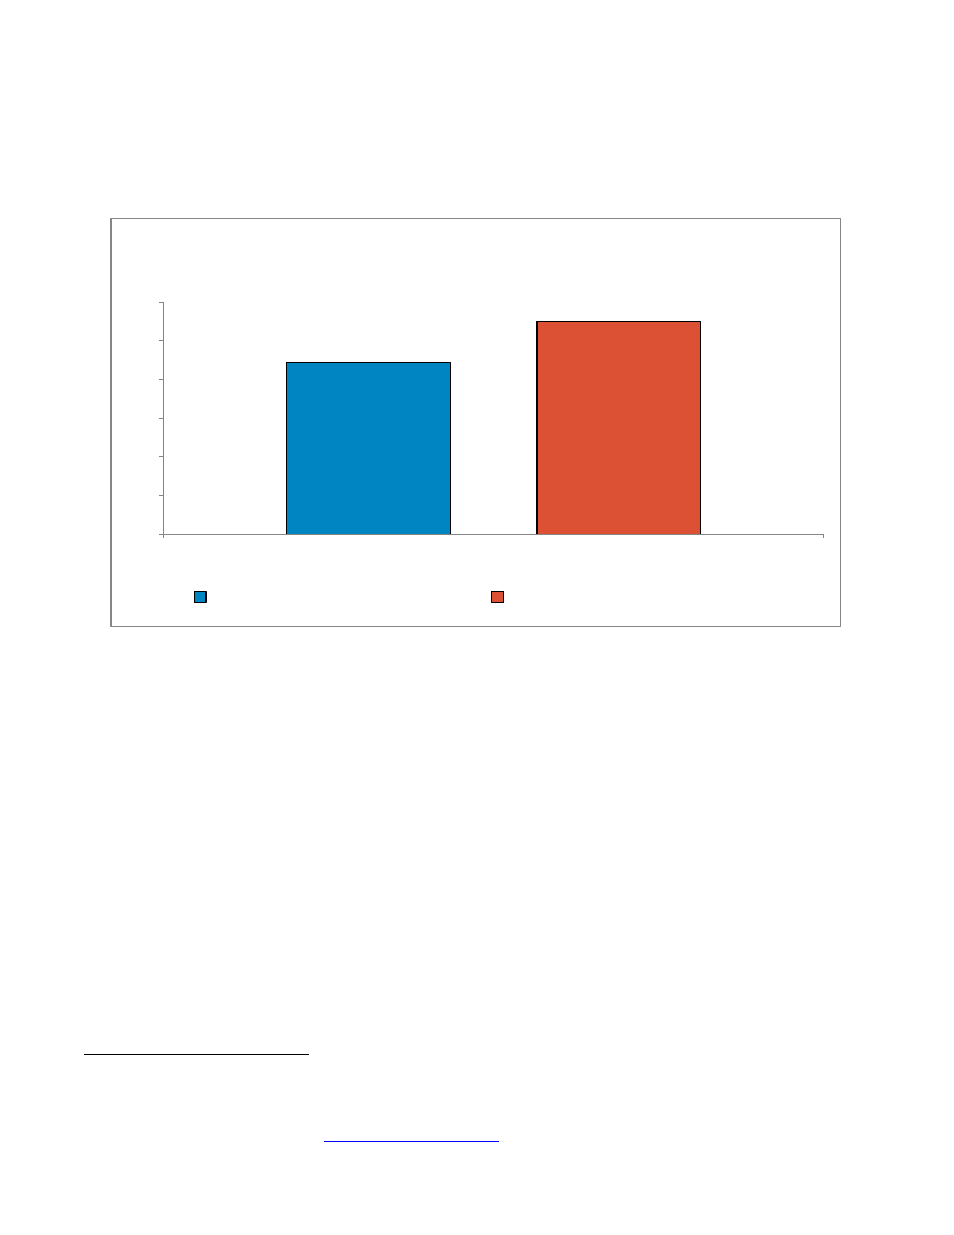
In Figure 3, the power draw of both servers at the 70% load level is shown.
Figure 3: Power utilization at 70% target load
3
At this interval, the HP ProLiant DL380p Gen8 consumed 53 watts more on average, 28% higher than the Dell
PowerEdge. This additional power utilization of the HP server caused its overall SPECpower_ssj2008 overall
ops/watt to be worse than the Dell PowerEdge R720.
3
Required SPEC disclosure information: R720 scores: (1,235,223 ssj_ops and 303W) @ 100% target load and 3,352 overall ssj_ops/watt vs.
DL380p Gen8: (1,217,238 ssj_ops and 324W) @ 100% and 2,861 overall ssj_ops/watt. Comparison based on results by Dell Labs June 2012.
SPEC® and the benchmark name SPECpower_ssj® are registered trademarks of the Standard Performance Evaluation Corporation. For
more information about SPECpower, see
222
275
0
50
100
150
200
250
300
Power draw in watts
(lower is better)
SPECpower results
power utilization at 70% target load
Dell PowerEdge R720
HP ProLiant DL380p Gen8