Bio-Rad Model 491 Prep Cell and Mini Prep Cell User Manual
Page 30
25
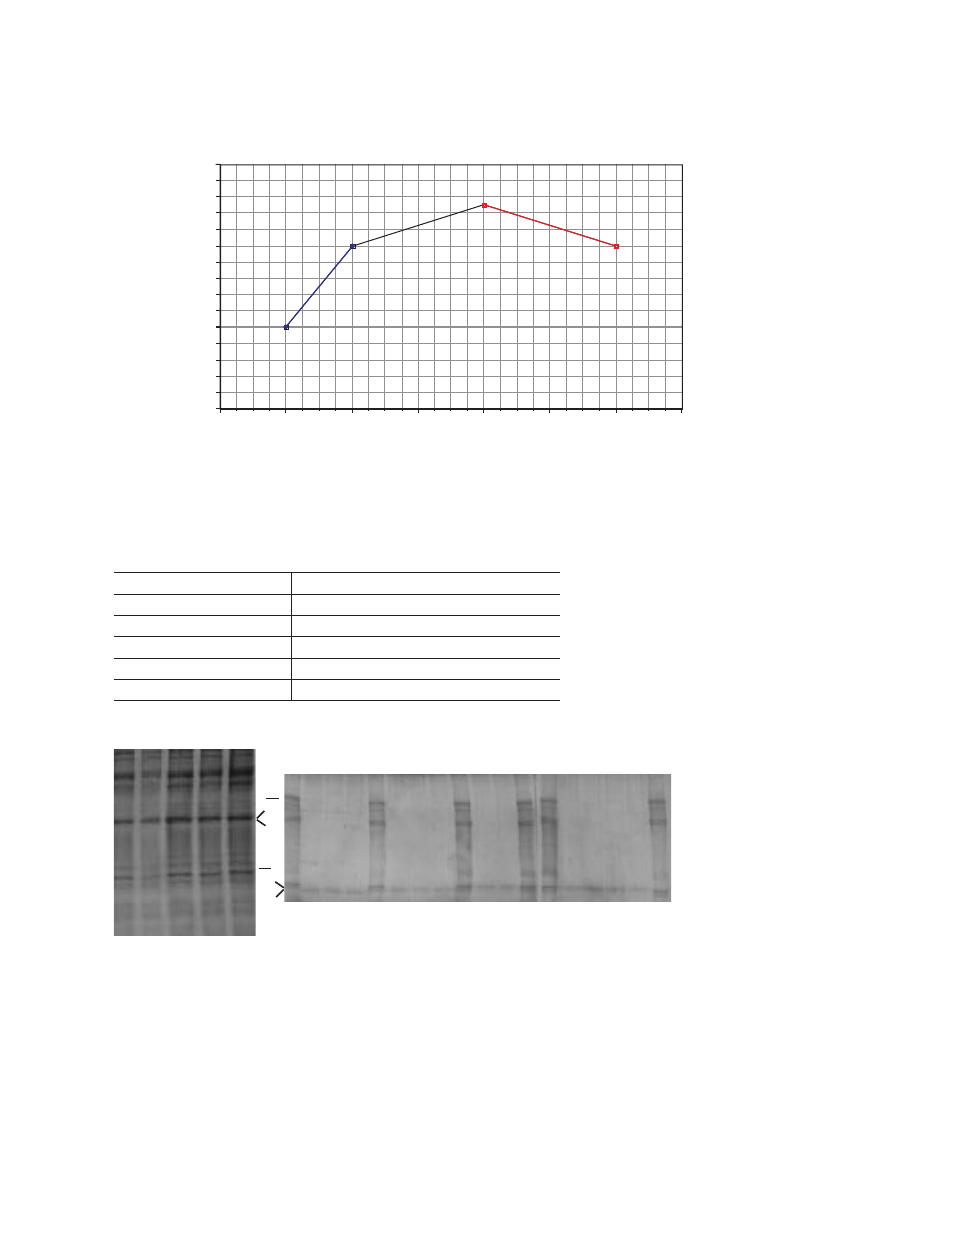
Fig. 14. Determination of optimal %T for 96 kD and 98 kD key hole limpet he mo cyanin proteins. The breakpoint of the curve is
con sidered the monomer concentration for optimal separation. In this case a 7%T/2.67%C monomer concentration is indicated.
Based on optimal %T data obtained from analytical mini-gels, subsequent prepara tive run conditions were
as shown in Table 7.
Table 7. Preparative run conditions based on optimal %T data obtained from analytical mini-gels.
Gel Composition
7% T/2.67% C
Gel Height
10 cm
Gel Size
28 mm
Sample Load
1 mg total protein
Running Conditions
40 mA constant current (250-350 V)
Running Time
8–10 hr
Fig. 15. Crude keyhole limpet hemocyanin (KLH) analyzed by SDS-PAGE. A, The locations of the 96 kD and the 98 kD bands are
indicated. B, SDS-PAGE analysis of aliquots taken from Model 491 prep cell fractions. The Model 491 prep cell separated the two
subunits of keyhole limpet hemo cyanin into two consecutive sets of six 2.5 ml nonoverlapping fractions. Crude KLH was run in about
every fourth lane. The 96 kD protein eluted in frac tions 110–115. The 98 kD protein eluted in fractions 116–117. There was no overlap.
25
A
B
kD
98
96
110
111
112
113
114
115
116
117
118
119
120
121
kD
98
96
11
10
9
8
7
6
5
4
0.5
0.6
0.7
0.8
0.9
1.0
1.1
1.2
1.3
1.4
1.5
1.6
1.7
1.8
1.9
2.0
%T
Distance between protein bands (mm
)
Keyhole limpet hemocyanin: separation of 96kd and 98kd proteins
Keyhole limpet hemocyanin: separation of 96 kD and 98 kD proteins
Distance between pr
otein bands, mm