Data logging chart display – Wilson Manifolds 810100 Progressive Nitrous Controller and Vehicle Data Logger User Manual
Page 13
Nitrous Pro-Flow, 4700 NE 11
th
St., Ft. Lauderdale, FL 33334 Pro-Flow Part. No. 810100
(954) 771-6216
www.nitrousproflow.com
1/2008
Page 13
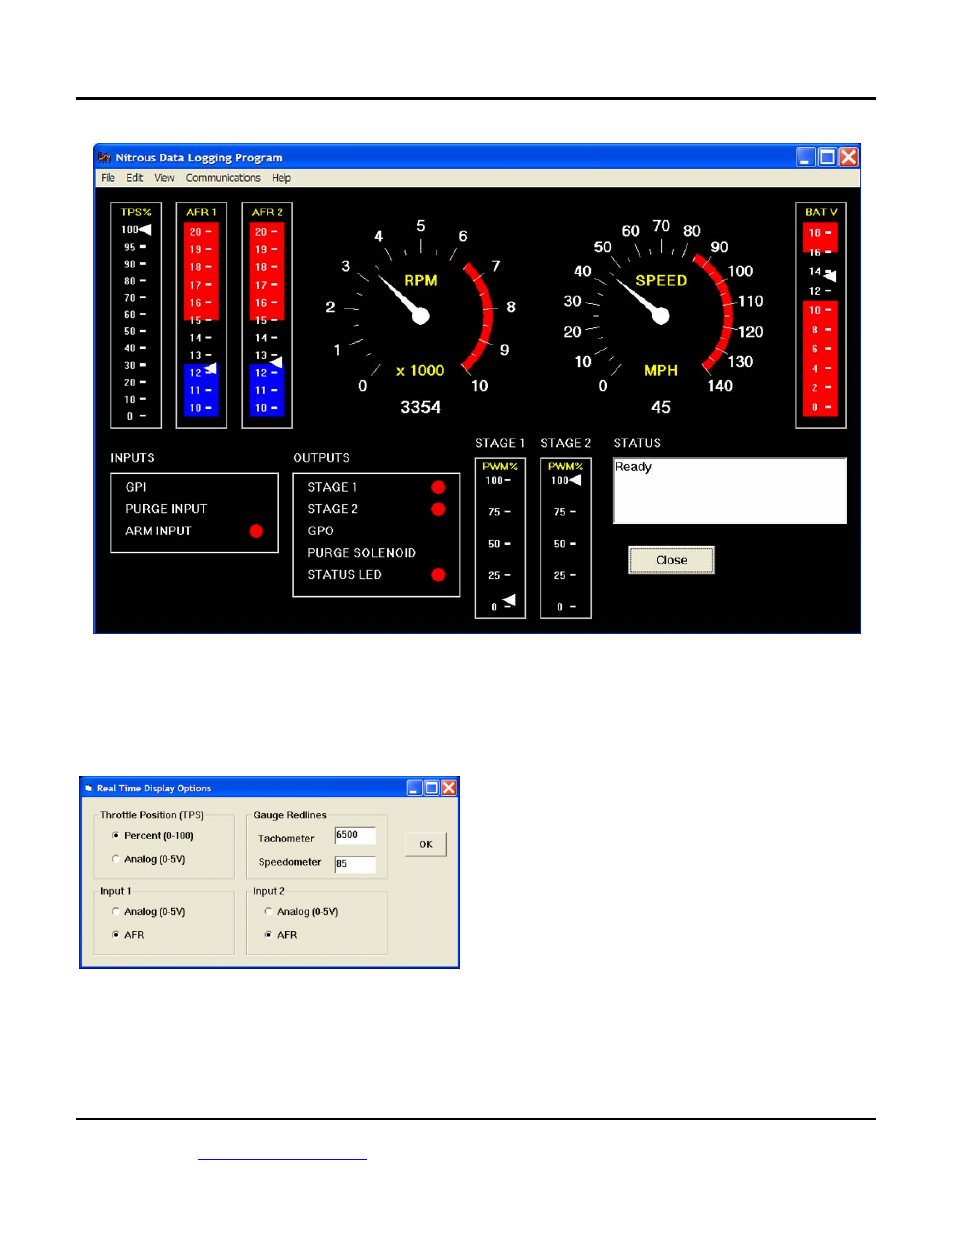
Figure 10 – Nitrous Log Real Time Display
You can configure throttle position display,
gauge redlines, and analog input display by using the
Real Time Display Options command from the Edit
menu as shown in Figure 11.
Figure 11 – Real Time Display Options
DATA LOGGING CHART DISPLAY
You can also display data logged by the nitrous
controller on a chart recorder type screen. Data logged
by the controller must be downloaded before it can be
displayed, by using the Download Data command on
the Communications menu. Once data has been
downloaded, it is automatically displayed. The last
data logged will appear at the right end of the
chart. You can save the data by using the Save File
command from the File menu. You can display a
previously saved data file by first using the Open File
command on the File menu and then using the View
Chart command on the View menu.
Note that nitrous controller data files use a .log
extension. You should create a separate folder to store
these files. A sample data file (Sample.log) is included
in the program folder.
You have a range of capabilities for analyzing
downloaded data displayed in the chart recorder
format. You can select two parameters for display.
Trace 1 is displayed in red with its Y axis legends on
the left side of the chart. Trace 2 is displayed in green
with its Y axis legends on the right side of the chart.