Viewing a spectrum chart – SATEC PAS User Manual
Page 25
V I E W I N G L O G F I L E S
23
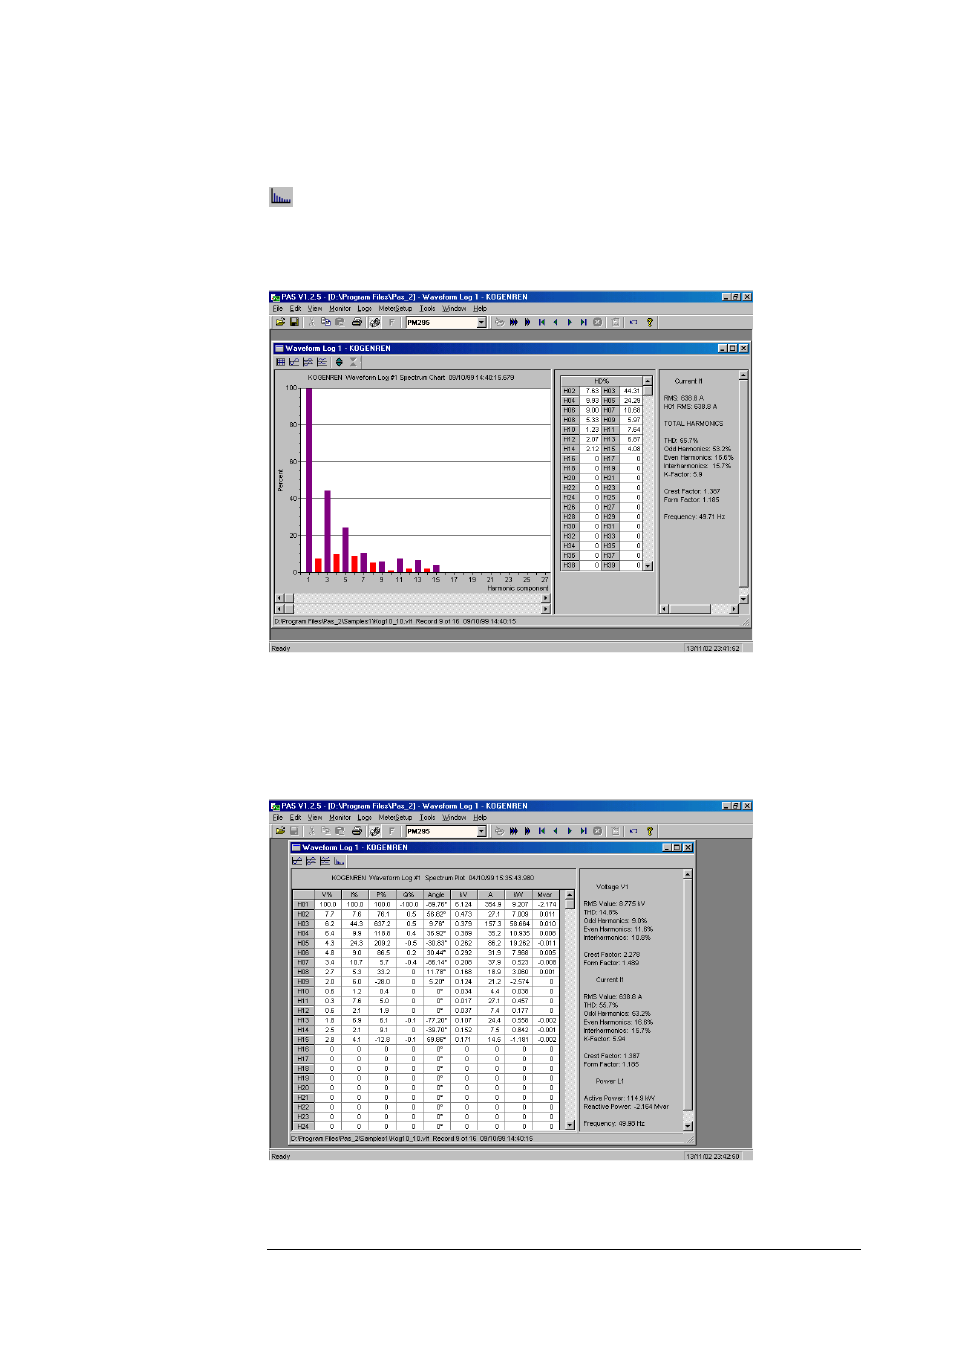
Viewing a Spectrum Chart
To view the spectrum chart for the selected waveform channel, click on the button
representing a spectrum graph. The spectrum is calculated over four cycles of
the selected waveform beginning from the point where the left marker line is
located in the open waveform view. If both waveform views are open, PAS gives
the priority to the overlapped waveform view.
The highest number of the spectrum harmonic that will be calculated is equal to
the half sampling rate at which the waveforms were sampled minus one. For
example, if the sampling made at a rate of 128 samples per cycle, 63 harmonics are
available. With 32 samples per cycle, only 15 harmonics will be calculated, while
others will be zeros.