Autostar #497 handbox appendix b – Meade Instruments LX850 User Manual
Page 52
In general, if seeing is poor, you will need to reduce
your guide rate so you do not chase seeing. Under
better conditions you can increase guide rates until
over correction starts to make the scope jump back
and forth across the star making it too wide again.
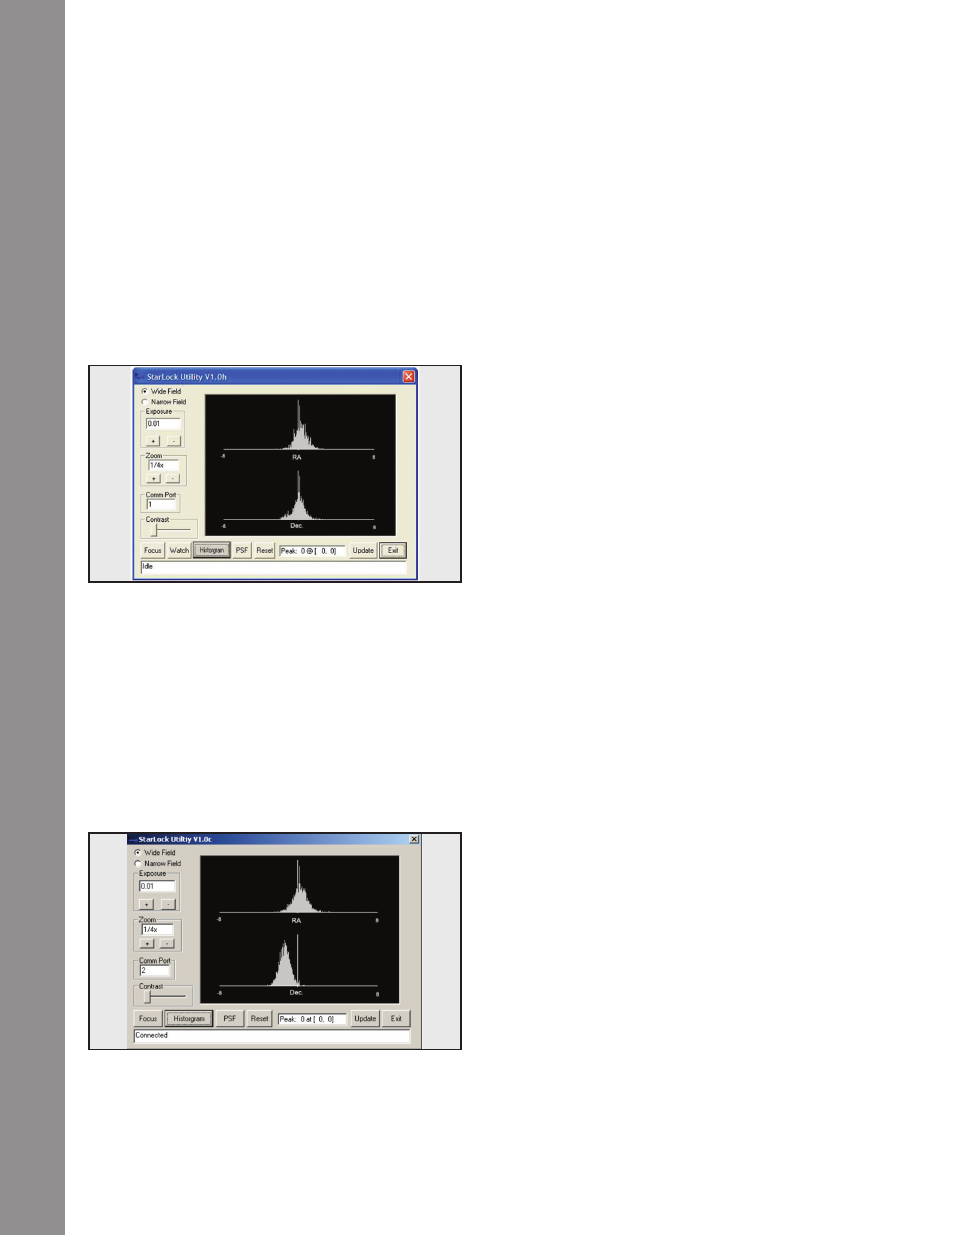
Histograms
The other way to monitor tracking is with the histogram
function. This plots how many corrections are made
at each distance. The result is typically a Gaussian
distribution function. The plot will tell you about seeing
and your alignment quality. To make this measurement
click on the Histogram button.
The example above is pretty typical. You can see
that both the RA and DEC corrections are plotted in
the range of –8 to +8 arcseconds. The width of the
distribution is an indication of seeing conditions. In
this case seeing is about 1/5 to 2 arcminutes. Both
distributions are pretty symmetric and centered on
zero. This indicates a good telescope alignment.
The plot above tells you that the scope is not too well
aligned. Notice that the DEC guide corrections are
not centered around zero. This is because the object
is drifting down in declination due to the scope being
poorly polar aligned. While the StarLock is succeeding
in tracking the star, you will get field rotation over time
due to scope misalignment and may not be able to
point to targets near the poles. When you see this type
of plot it is time to drift align, or realign your scope.
If you see an RA histogram with two humps, you are
guiding too aggressively and need to reduce your
guide rate.
AutoStar #497 HANDBOX
Appendix B
52
Fig 42: Typical Histogram
Fig 43: Poorly aligned telescope