Exploring the pages : the almanac page – Bushnell Onix 364000 User Manual
Page 15
15
eXPloring the Pages : the almanac Page
animals and fish seem to exhibit higher or lower levels of activity related to
the position of the sun and moon (think of its effect on tides). The graph at
the bottom of the Almanac page displays the estimated level of animal or
fish activity based on the stored data. The “0” line in the middle represents
an average level of activity, while “+” or “-” readings (respectively) indicate
higher and lower activity levels.
Several options are available on the Almanac page:
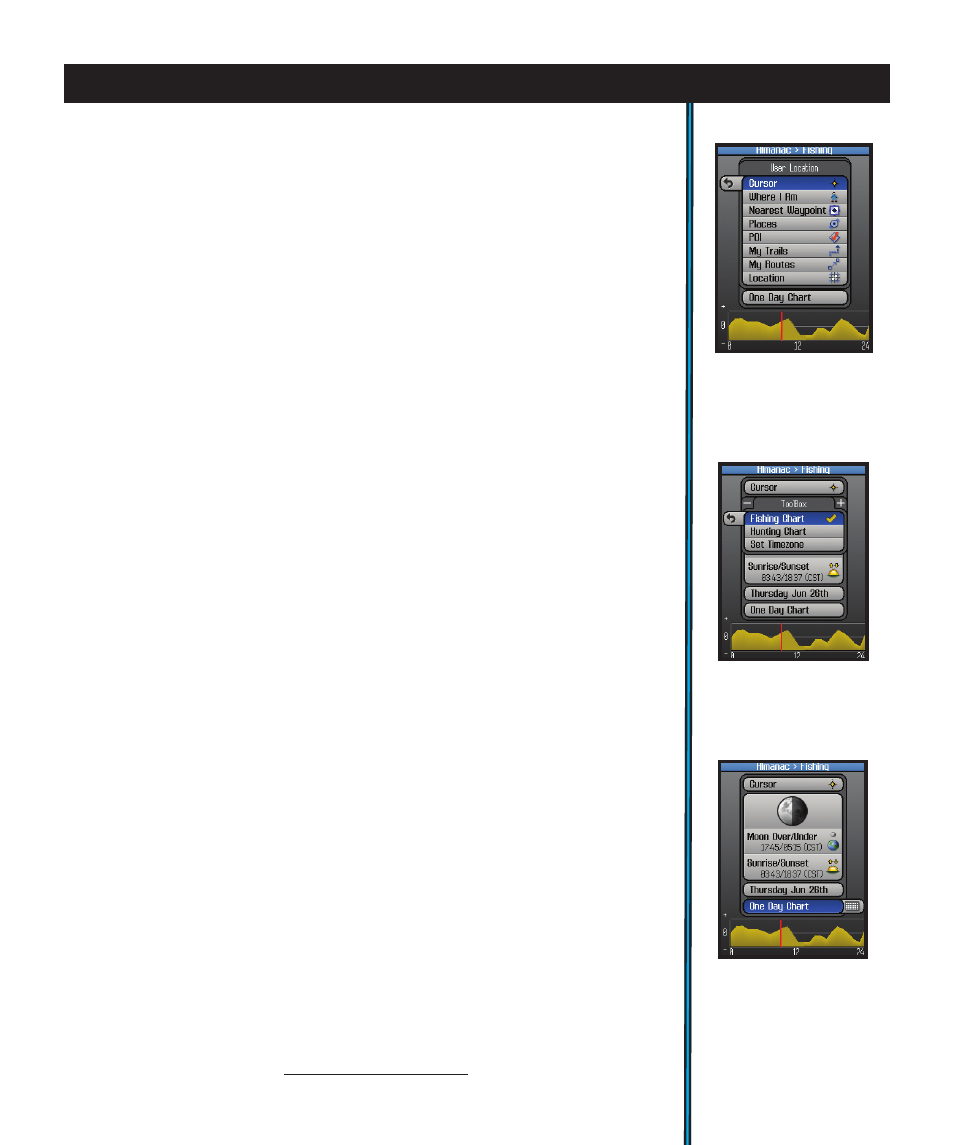
• With the top box (above the moon phase graphic) selected, press the
RIGHT key to see location options (Fig. 18) for the solunar data (data
shown is for “where”?). To see the data for your current location, select
“Where I Am”. Or, move your cursor on the MAP page anywhere you like,
and select “Cursor” on the Almanac page to see the data for that location.
Other options include selecting a waypoint you stored earlier, a POI, any
geographic location (latitude/longitude), etc.
• Press the HOT button to open a ToolBox with three options (Fig. 19):
Fishing Chart-highlight this and press OK (a checkmark will appear) if
you want the animal activity level chart to be relevant for fish.
Hunting Chart-select and check this if you prefer the activity graph to
indicated mammal activity levels.
Set Timezone-select this and press OK to temporarily jump to the “Time”
options on the SET page (24 hr or AM/PM format, daylight savings, etc).
• To change the date (for example, if you want to see the solunar data and
predicted activity level for a day in the future), press the DOWN key to select
the date box. Now you can press the LEFT or RIGHT keys to go back or move
ahead to a different date. Or, press OK to get a popup one month calender,
then use the 4-way keypad to select a date and press OK. Pressing the “-” or
“+” buttons when the calender is displayed will change it to a past or future
month.
• Press the DOWN key to select the “time period” box just above the graph,
then press either the OK button or RIGHT key to toggle between displaying
an animal/fish activity chart for One Day (Fig. 20) (just the currently displayed
date in the box above the time period) or for a One Month period of time.
Note: The green area that will appear shows the correction to the activity
graph based on SoLunar Edge Technology. A red line indicates the selected day
(One Month mode) or current time (One Day mode).
* For more information on patented Solunar Edge technology and Speedtech
Instruments products, visit www.Speedtech.com
Fig 18.
Almanac Page
(Location
Options)
Fig 20.
Almanac Chart: Time
Period=1 Day
Fig 19.
Almanac Chart:
HOT Button