Continue – Pioneer VSX-921 User Manual
Page 19
19
How to Interpret the Graphs (Continued)
About the display of the reverb characteristics graphs before
and after calibration
By comparing the reverberation characteristics graphs before and after calibration, you can check how the
reverb characteristics have been calibrated. Select “Before” to display the graph of the reverberation
characteristics before EQ calibration, “After” to display the graph of the reverb characteristics after EQ
calibration. If you want to check the actually measured reverb characteristics after EQ calibration, see
Displaying the reverb characteristics after EQ calibration (actually measured values) (page 20)
.
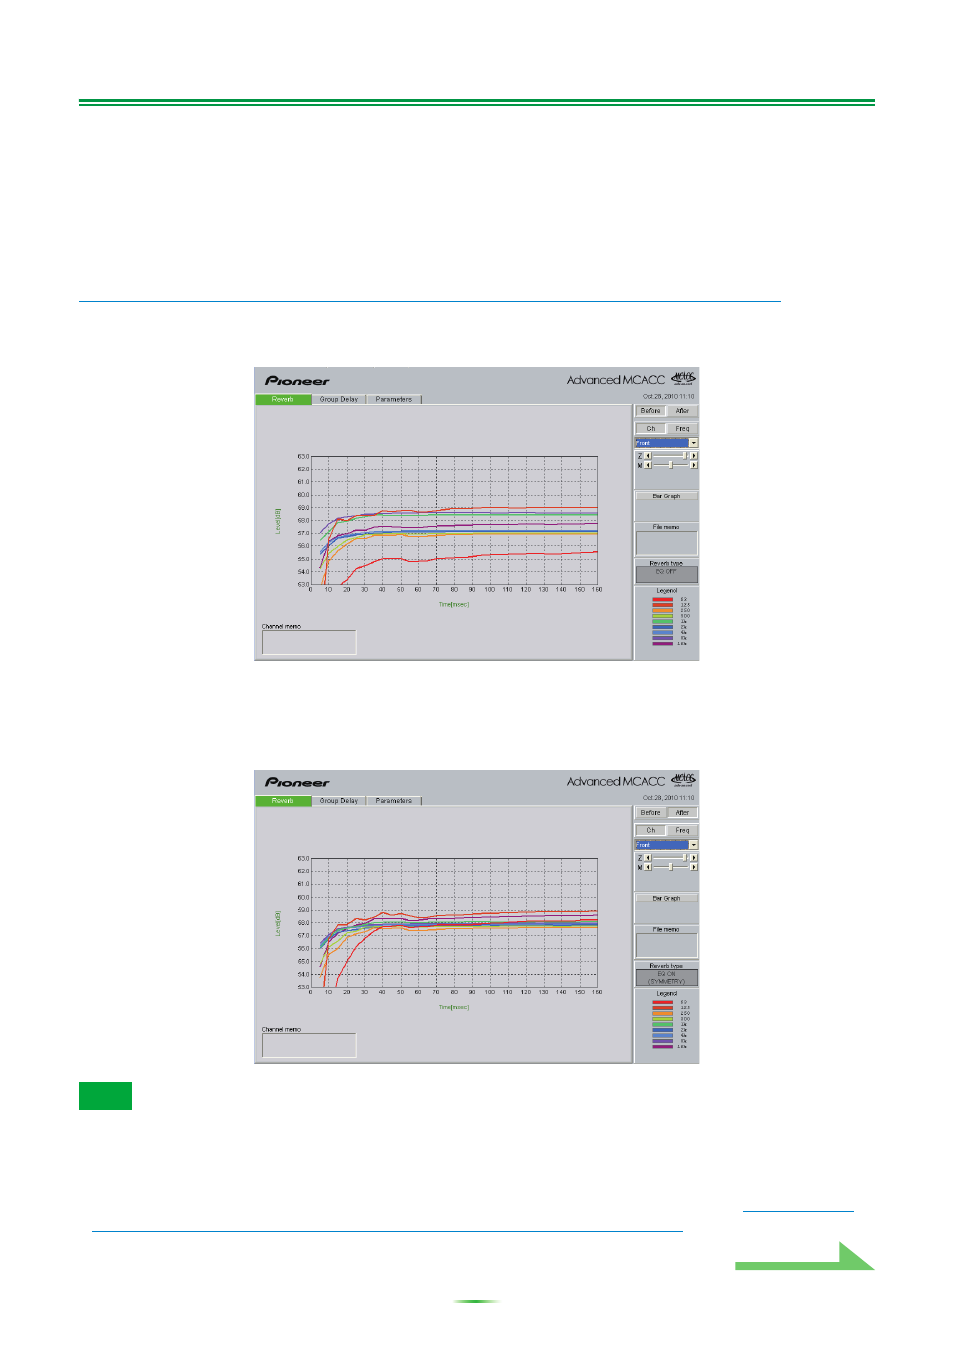
Graph of reverb characteristics before calibration
You can see that the reverb characteristics of the various frequencies of the different channels are uneven.
Graph of reverb characteristics after calibration
You can see that compared to the graph before calibration the lines for the individual frequencies move
vertically in parallel by the amount of equalization and converge near the specified point on the time axis
(30-50 ms by default).
• The graphs displaying reverb measurements both before and after calibration are displayed in 2-D for
comparison purposes.
• With Full Auto MCACC, the “After” graph can only be displayed when calibration is performed with the EQ
Type set to SYMMETRY. When calibration is performed with the EQ Type set to either ALL CH ADJ or
FRONT ALIGN, measure the actual reverberation characteristics again. For details, see
Displaying the
reverb characteristics after EQ calibration (actually measured values) (page 20)
.
Note
Continue