Typical performance plots, Figure 18. frequency response – Cirrus Logic CRD44600-PH-FB User Manual
Page 26
CRD44600-PH-FB
26
MAR '05 DS633RD1
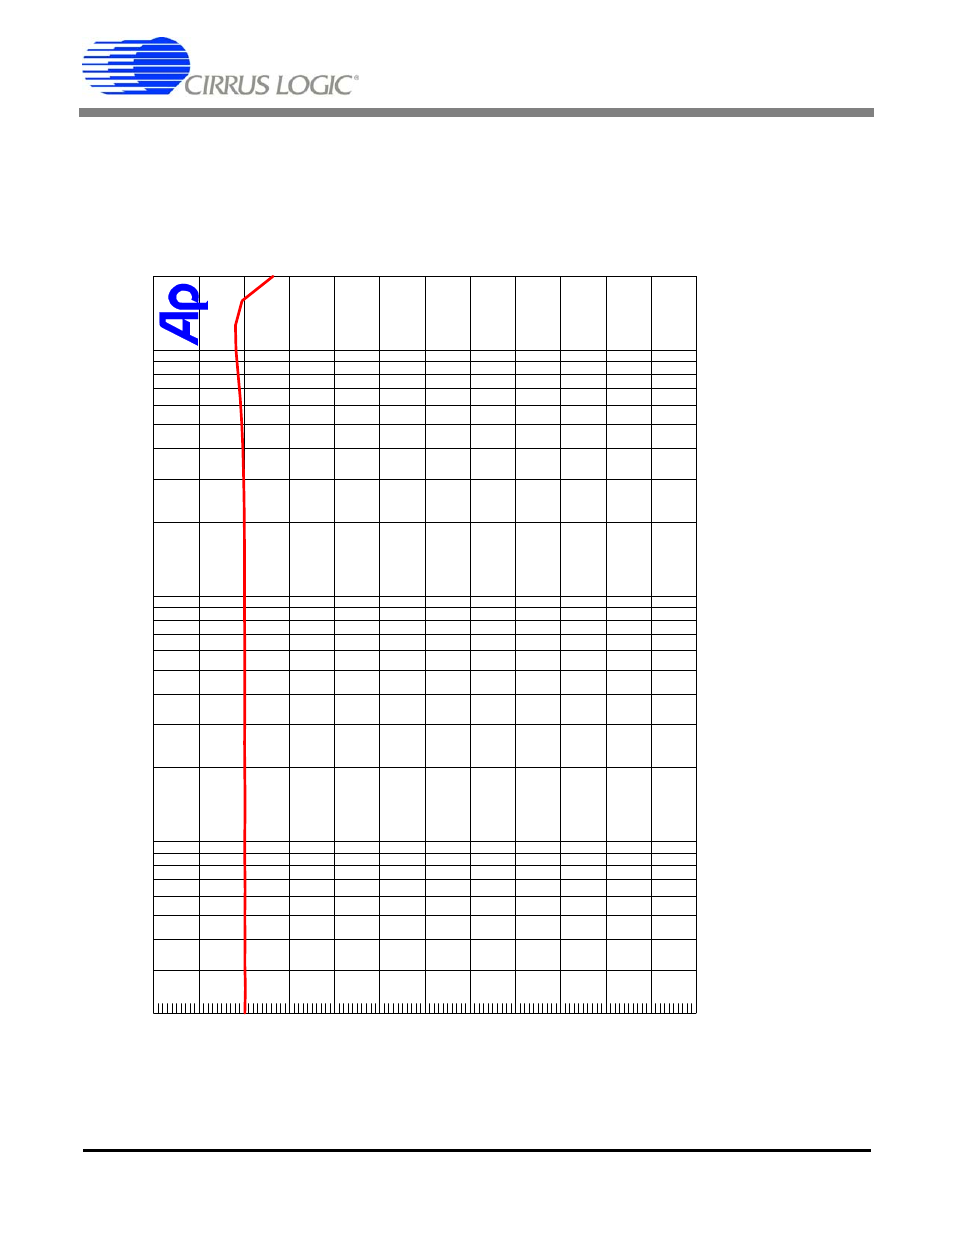
9. TYPICAL PERFORMANCE PLOTS
These performance plots were taken with the CRD44600-PH-FB powered from the described
+50 V linear unregulated power supply. The PSR circuitry was calibrated to a nominal +50 V rail.
-5
+1
-4.5
-4
-3.5
-3
-2.5
-2
-1.5
-1
-0.5
-0
+0.5
d
B
r
A
20
20k
50
100
200
500
1k
2k
5k
10k
Hz
Fi
g
u
re
1
8
.
Fr
eq
uen
cy
Res
p
o
n
s
e
See also other documents in the category Cirrus Logic Hardware:
- CobraNet (147 pages)
- CS4961xx (54 pages)
- CS150x (8 pages)
- CS1501 (16 pages)
- CS1601 (2 pages)
- CS1601 (16 pages)
- CS1610 (16 pages)
- CRD1610-8W (24 pages)
- CRD1611-8W (25 pages)
- CDB1610-8W (21 pages)
- CS1610A (18 pages)
- CDB1611-8W (21 pages)
- CDB1610A-8W (21 pages)
- CDB1611A-8W (21 pages)
- CRD1610A-8W (24 pages)
- CRD1611A-8W (25 pages)
- CS1615 (16 pages)
- AN403 (15 pages)
- AN401 (14 pages)
- AN400 (15 pages)
- AN375 (27 pages)
- AN376 (9 pages)
- CRD1615-8W (22 pages)
- CRD1616-8W (23 pages)
- AN402 (14 pages)
- AN404 (15 pages)
- CRD1615A-8W (21 pages)
- CS1615A (16 pages)
- CS1630 (56 pages)
- AN374 (35 pages)
- AN368 (80 pages)
- CRD1630-10W (24 pages)
- CRD1631-10W (25 pages)
- CS1680 (16 pages)
- AN405 (13 pages)
- AN379 (31 pages)
- CRD1680-7W (31 pages)
- AN335 (10 pages)
- AN334 (6 pages)
- AN312 (14 pages)
- AN Integrating CobraNet into Audio Products (16 pages)
- CobraNet Audio Routing Primer (9 pages)
- Bundle Assignments in CobraNet Systems (3 pages)
- CS2300-01 (3 pages)
- CS2000-CP (38 pages)