Digital filter response plots, Figure 7. single-speed stopband rejection, Figure 8. single-speed transition band – Cirrus Logic CS4352 User Manual
Page 16: Figure 9. single-speed transition band (detail), Figure 10. single-speed passband ripple, Figure 11. double-speed stopband rejection, Figure 12. double-speed transition band
16
DS684F2
CS4352
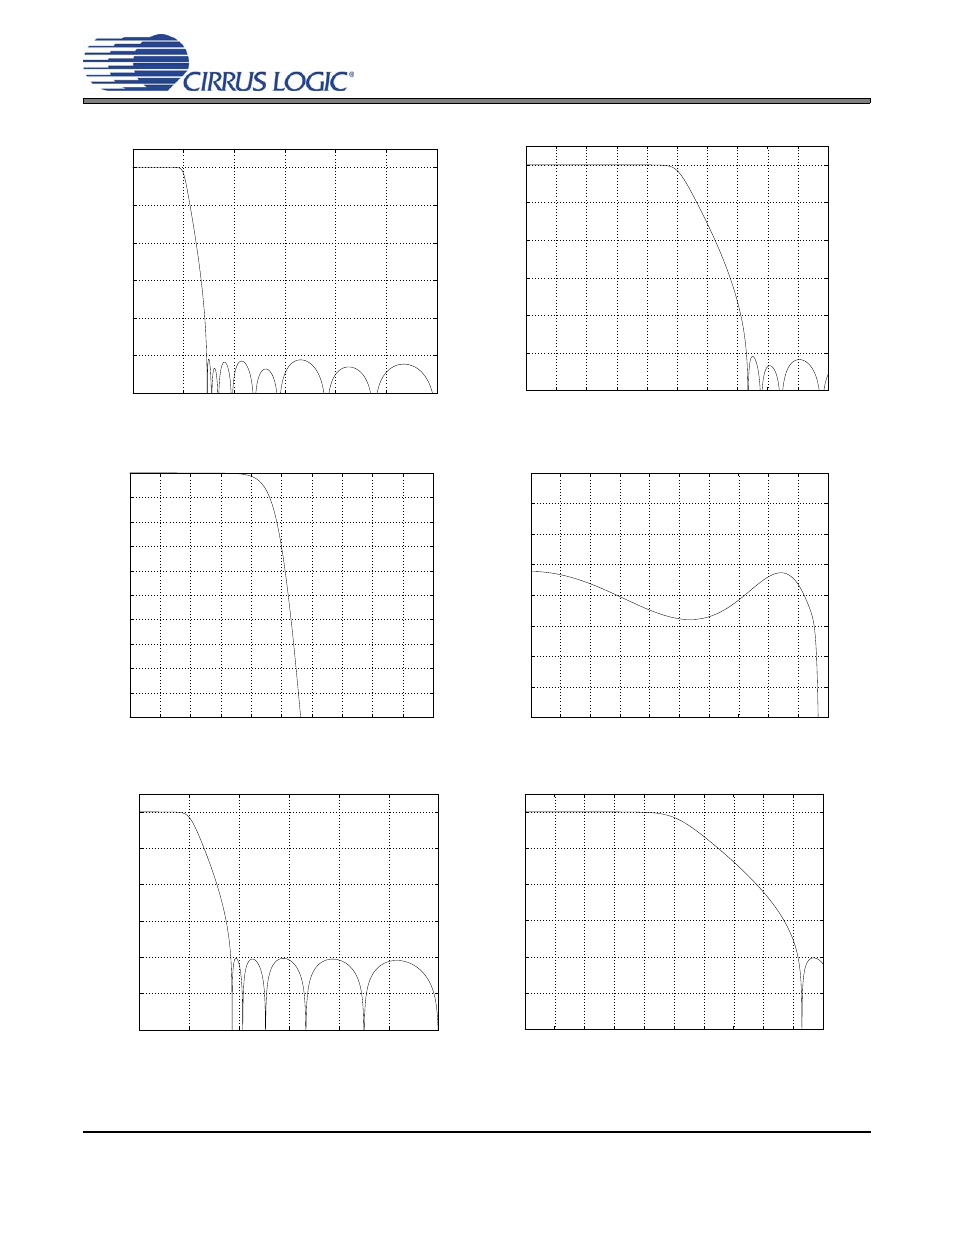
5. DIGITAL FILTER RESPONSE PLOTS
0.4
0.5
0.6
0.7
0.8
0.9
1
−120
−100
−80
−60
−40
−20
0
Frequency(normalized to Fs)
Amplitude (dB)
0.4
0.42
0.44
0.46
0.48
0.5
0.52
0.54
0.56
0.58
0.6
−120
−100
−80
−60
−40
−20
0
Frequency(normalized to Fs)
Amplitude (dB)
Figure 7. Single-Speed Stopband Rejection
Figure 8. Single-Speed Transition Band
0.45
0.46
0.47
0.48
0.49
0.5
0.51
0.52
0.53
0.54
0.55
−10
−9
−8
−7
−6
−5
−4
−3
−2
−1
0
Frequency(normalized to Fs)
Amplitude (dB)
0
0.05
0.1
0.15
0.2
0.25
0.3
0.35
0.4
0.45
0.5
−0.02
−0.015
−0.01
−0.005
0
0.005
0.01
0.015
0.02
Frequency(normalized to Fs)
Amplitude (dB)
Figure 9. Single-Speed Transition Band (detail)
Figure 10. Single-Speed Passband Ripple
0.4
0.5
0.6
0.7
0.8
0.9
1
120
100
80
60
40
20
0
Frequency(normalized to Fs)
Amplitude (dB)
0.4
0.42
0.44
0.46
0.48
0.5
0.52
0.54
0.56
0.58
0.6
120
100
80
60
40
20
0
Frequency(normalized to Fs)
Amplitude (dB)
Figure 11. Double-Speed Stopband Rejection
Figure 12. Double-Speed Transition Band