Performance plots, Figure 9. dynamic range - line in to s/pdif out, Figure 10. freq. resp. - line in to s/pdif out – Cirrus Logic CRD42L52 User Manual
Page 15: Figure 11. thd + n - line in to s/pdif out, Figure 12. fft - s/pdif in to hp out @ 0 dbfs
DS680RD1
15
CRD42L52
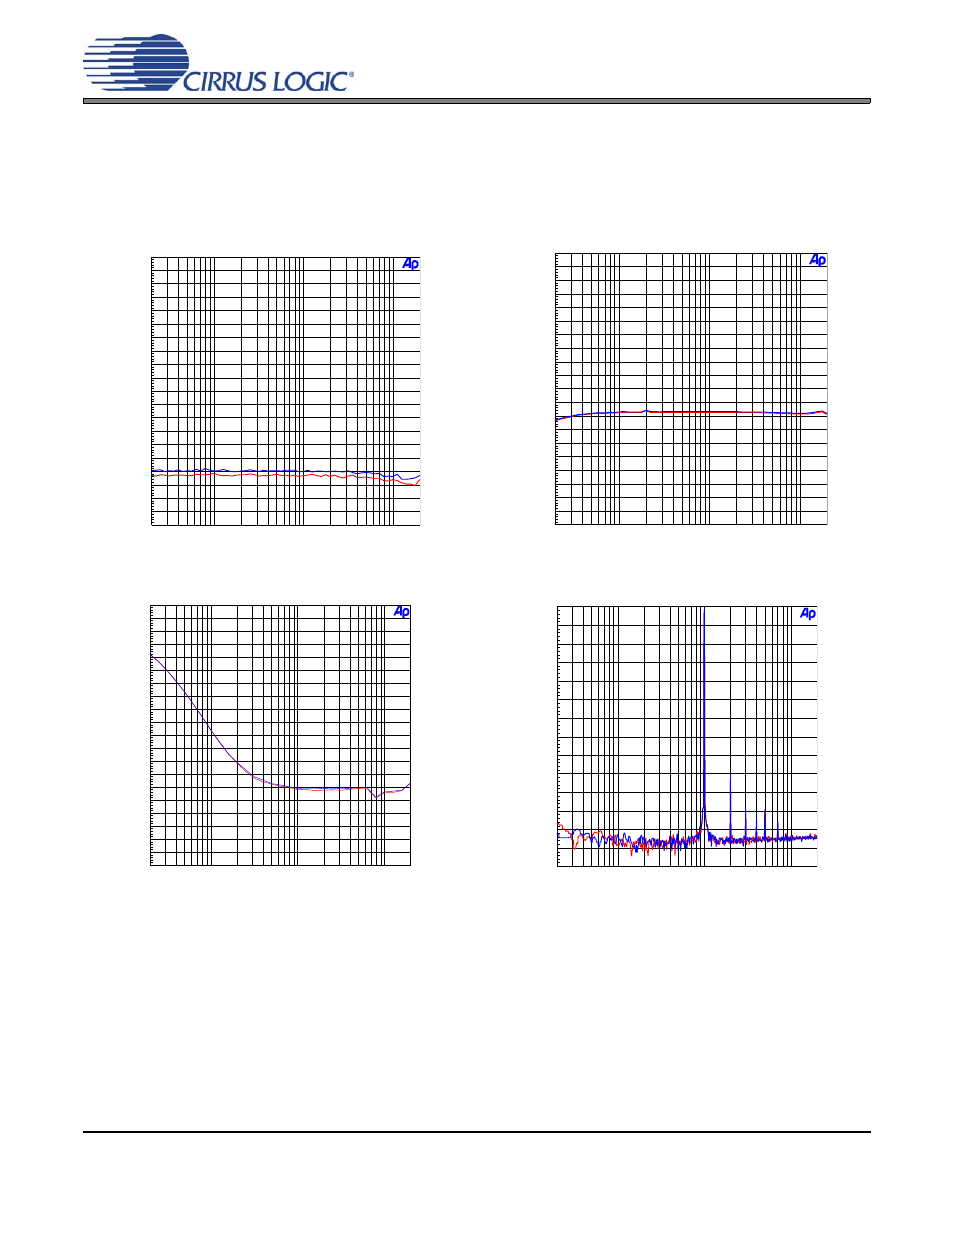
5. PERFORMANCE PLOTS
Test conditions (unless otherwise specified): Input test signal is a full-scale 997 Hz sine wave; measurement band-
width is 20 Hz to 20 kHz (unweighted); VA=VD=VA_HP=1.8 V; Sample Frequency = 48 kHz; HP test load:
R
L
= 10 k
Ω.
Notes:
1.
The total harmonic distortion + noise (THD+N) performance of the ADC in the CS42L52 is determined by
the value of the capacitor on the FILT+ pin. Larger capacitor values yield significant improvement in THD+N
at low frequencies. A 1 uF capacitor was used to make the performance measurement in
-100
-50
-97.5
-95
-92.5
-90
-87.5
-85
-82.5
-80
-77.5
-75
-72.5
-70
-67.5
-65
-62.5
-60
-57.5
-55
-52.5
d
B
F
S
20
20k
50
100
200
500
1k
2k
5k
10k
Hz
-5
+5
-4.5
-4
-3.5
-3
-2.5
-2
-1.5
-1
-0.5
-0
+0.5
+1
+1.5
+2
+2.5
+3
+3.5
+4
+4.5
d
B
F
S
20
20k
50
100
200
500
1k
2k
5k
10k
Hz
Figure 9. Dynamic Range - Line In to S/PDIF Out
Figure 10. Freq. Resp. - Line In to S/PDIF Out
-100
-50
-97.5
-95
-92.5
-90
-87.5
-85
-82.5
-80
-77.5
-75
-72.5
-70
-67.5
-65
-62.5
-60
-57.5
-55
-52.5
d
B
F
S
20
20k
50
100
200
500
1k
2k
5k
10k
Hz
Figure 11. THD + N - Line In to S/PDIF Out
Figure 12. FFT - S/PDIF In to HP Out @ 0 dBFS
*
-140
+0
-130
-120
-110
-100
-90
-80
-70
-60
-50
-40
-30
-20
-10
d
B
r
A
20
20k
50
100
200
500
1k
2k
5k
10k
Hz