Typical calibration chart – Ashcroft 1495 - Low Pressure Receiver Gauge User Manual
Page 10
10
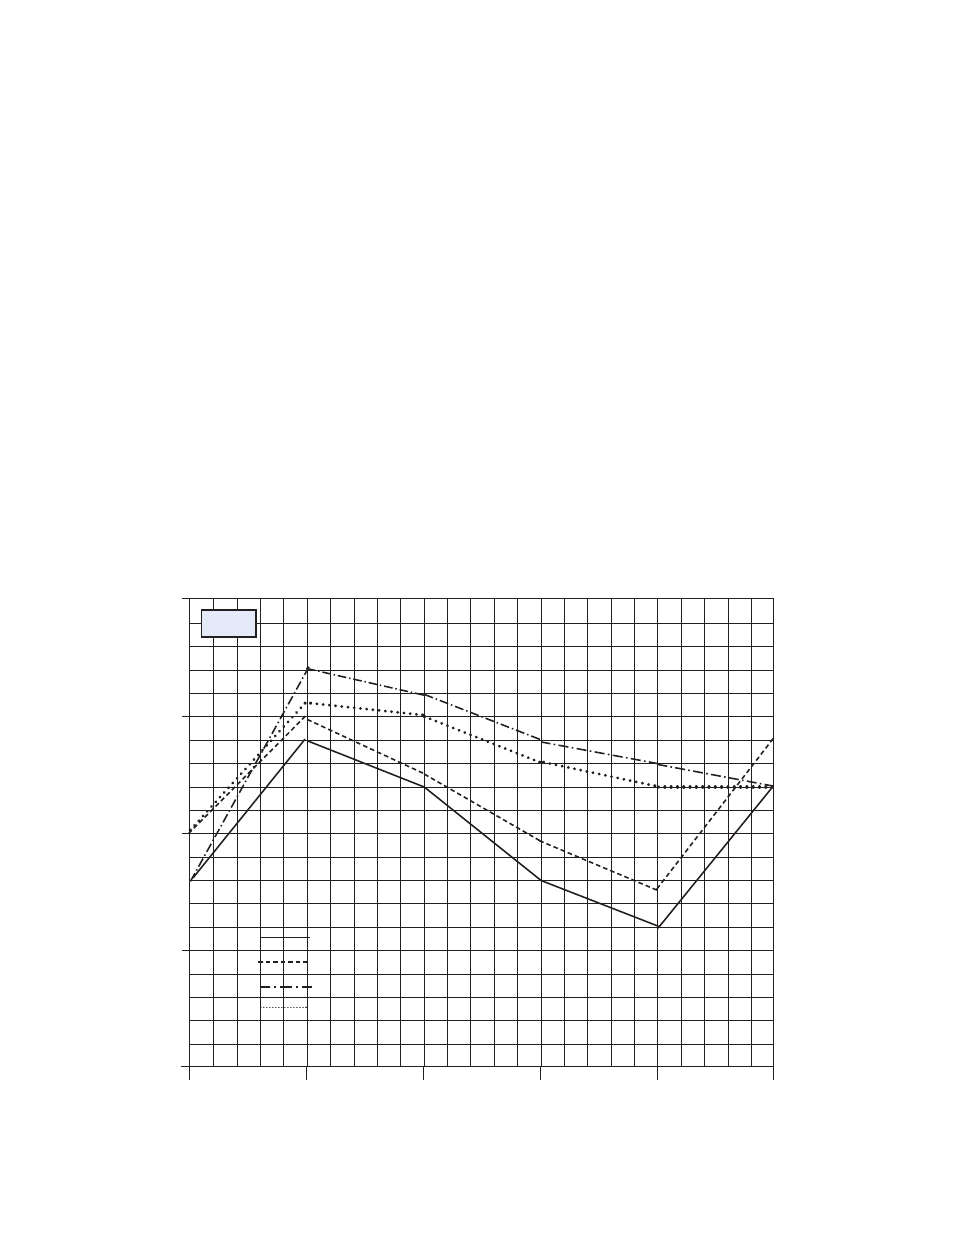
TYPICAL CALIBRATION CHART
INDICATED VALUE (PSI)
True Value –
Increasing –
Increasing –
Decreasing –
Decreasing –
PSI
Without RAP
With RAP
Without RAP
With RAP
0
–.4
0
–.4
0
40
+.8
+1.0
+1.4
+1.1
80
+.4
+.5
+1.2
+1.0
120
–.4
–1.0
+.8
+.6
160
–.8
–.5
+.6
+.4
200
+.4
+.8
+.4
+.4
ERROR (% OF FULL SCALE)
True Value –
Increasing –
Increasing –
Decreasing –
Decreasing –
% of Range
Without RAP
With RAP
Without RAP
With RAP
0
–.20
0
–.20
0
20
+.40
+.50
+.70
+.55
40
+.20
+.25
+.60
+.50
60
–.20
–.05
+.40
+.30
80
–.40
–.25
+.30
+.20
100
+.20
+.40
+.20
+.20
1.0
0.5
0.0
–0.5
–1.0
0
20
40
60
80
100
% of Range
◆
◆
◆
◆
■
■
■
■
●
●
●
●
●
●
▲
▲
▲
▲
▲
▲
▲
▲
upscale – without rap
●
●
upscale – with rap
◆
◆
downscale – without rap
■
■
downscale – with rap
E
rr
o
r
(%
o
f
F
u
ll
S
c
a
le
)
Fig. 1
This manual is related to the following products: