Main user interface – Vaisala Observation Display User Manual
Page 19

Chapter 4 ____________________________________________________________ Basic Features
Main User Interface
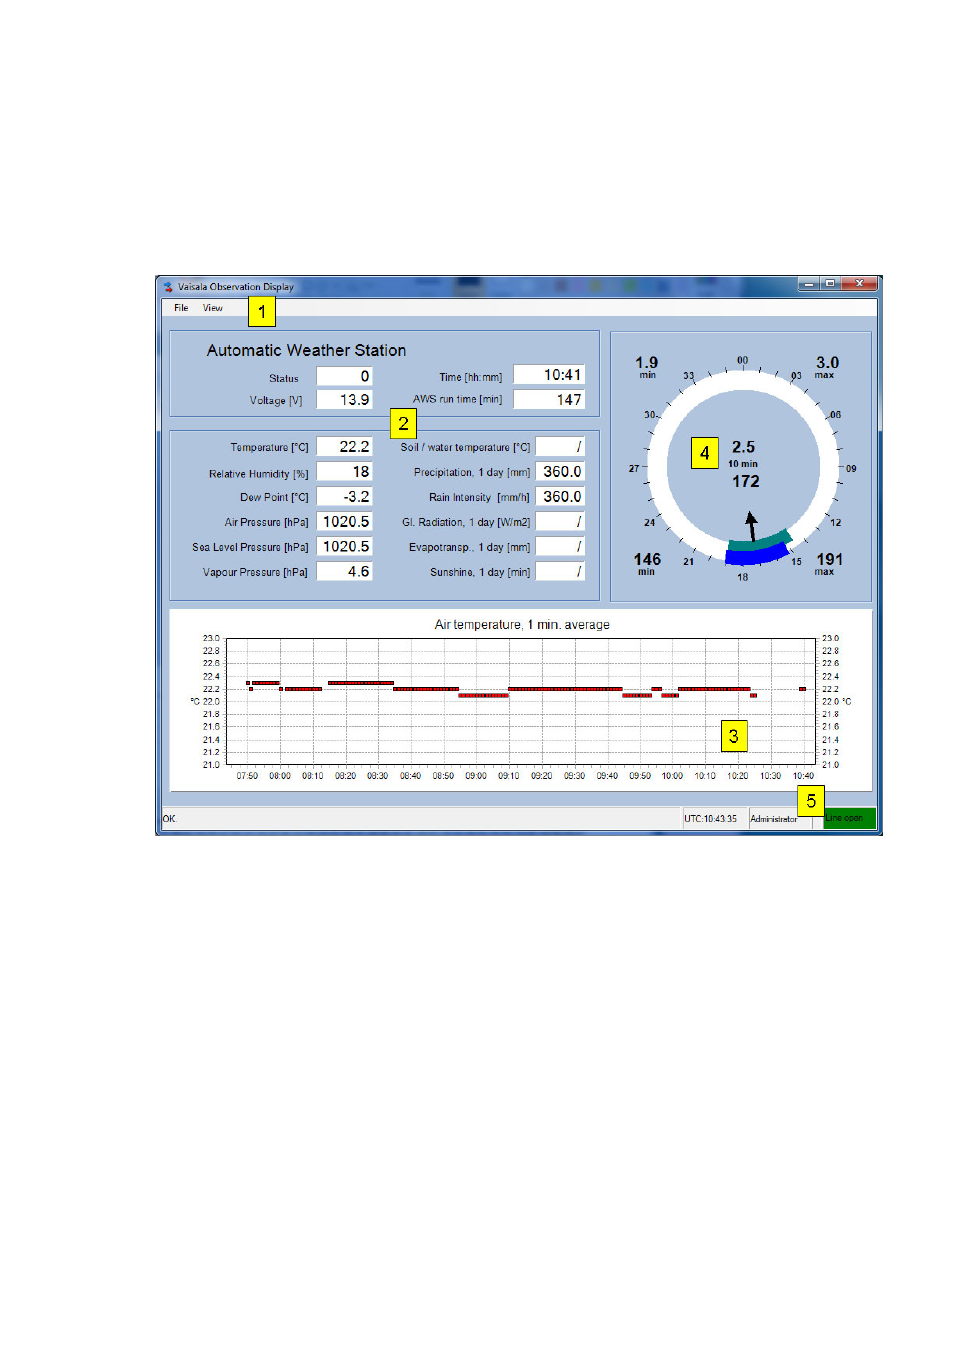
A sample of the main user interface displaying the real-time data is
shown in Figure 2 below.
1012-044
Figure 2
Main User Interface
The following numbers refer to Figure 2 above:
1 = Menu bar, which contains operating commands
2 = Text section, which shows the latest measurement values
3 = Graph section, which contains configurable graphs
4 = Wind display component
5 = Status bar, which displays UTC time, current user, and status of
the communications line
The display is highly configurable. An administrator user may
completely change the layout and all settings of display elements. An
observer user can modify some of the display settings.
VAISALA _______________________________________________________________________ 17
